Interactive image stack viewing in jupyter notebooks

Project description
stackview 🧊👀


Interactive image stack viewing in jupyter notebooks based on ipycanvas and ipywidgets. TL;DR:
stackview.curtain(image, labels, continuous_update=True)
Installation
stackview can be installed using conda or pip.
conda install -c conda-forge stackview
OR
pip install stackview
If you run the installation from within a notebook, you need to restart Jupyter (not just the kernel), before you can use stackview.
Usage
You can use stackview from within jupyter notebooks as shown below.
Also check out the demo in

There is also a notebook demonstrating how to use stackview in Google Colab.
More example notebooks can be found in this folder.
Starting point is a 3D image dataset provided as numpy array.
from skimage.io import imread
image = imread('data/Haase_MRT_tfl3d1.tif', plugin='tifffile')
Slice view
You can then view it slice-by-slice:
import stackview
stackview.slice(image, continuous_update=True)
Pick intensities
To read the intensity of pixels where the mouse is moving, use the picker.
stackview.picker(image)
Display range
To adjust the minimum and maximum intensity shown when displaying an image, use the display_range function.
stackview.display_range(image)
Interactive histogram
stackview.histogram(image)
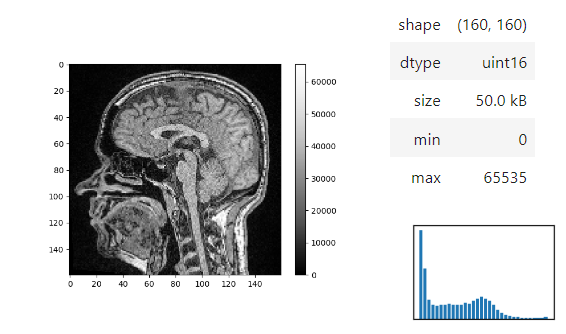
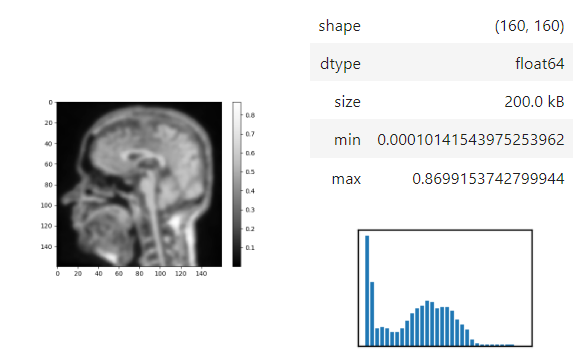
Static insight views
The insight function turns a numpy-array into a numpy-compatible array that has an image-display in jupyter notebooks.
stackview.insight(image[60])
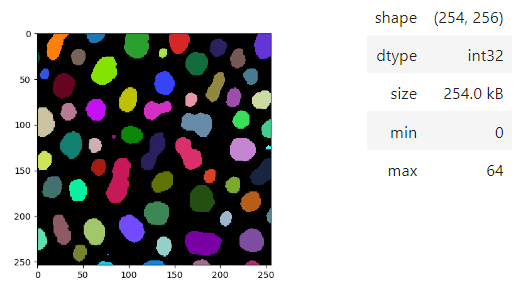
Images of 32-bit and 64-bit type integer are displayed as labels.
blobs = imread('data/blobs.tif')
labels = label(blobs > 120)

stackview.insight(labels)
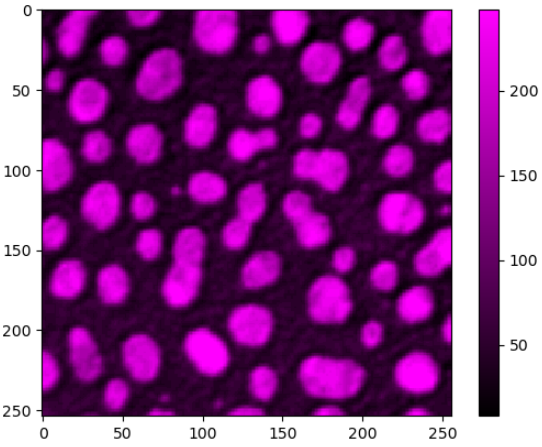
matplotlib-like imshow
To visualize images with more flexibility, there is imshow, which works similar like matplotlib's imshow and yet adds more flexibily, e.g. when it comes to colormaps. It supports pure... colormaps introduced in microfilm.
stackview.imshow(image, axes=True, colorbar=True, colormap='pure_magenta')
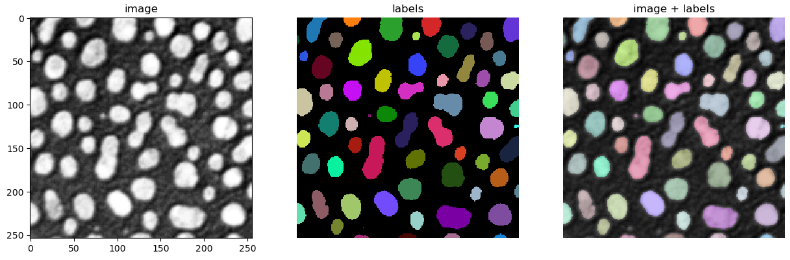
... or drawing label images.
import matplotlib.pyplot as plt
fig, axs = plt.subplots(1, 3, figsize=(15,15))

stackview.imshow(image, plot=axs[0], title='image', axes=True)
stackview.imshow(labels, plot=axs[1], title='labels')

stackview.imshow(image, plot=axs[2], continue_drawing=True)
stackview.imshow(labels, plot=axs[2], alpha=0.4, title='image + labels')
Static animations
The animate, animate_curtain and animate_blend functions can be used to store animations of image stacks / images blended over each other as gif to disk.
stackview.animate(blobs_images, frame_delay_ms=50)
stackview.animate_curtain(blobs, blobs > 128)

Annotate regions
To create label images interactively, e.g. for machine learning training, the stackview.annotate function offers basic label drawing tools.
Click and drag for drawing. Hold the ALT key for erasing.
Annotations are drawn into a labels image you need to create before drawing.
import numpy as np
labels = np.zeros(image.shape).astype(np.uint32)

stackview.annotate(image, labels)
Note: In case the interface is slow, consider using smaller images, e.g. by cropping or resampling.
Orthogonal view
Orthogonal views are also available:
stackview.orthogonal(image)
Curtain
Furthermore, to visualize an original image in combination with a processed version, a curtain view may be helpful:
stackview.curtain(image, modified_image * 65537)
The curtain also works with 2D data. Btw. to visualize both images properly, you need adjust their grey value range yourself. For example, multiply a binary image with 255 so that it visualizes nicely side-by-side with the original image in 8-bit range:
binary = (slice_image > threshold_otsu(slice_image)) * 255
stackview.curtain(slice_image, binary)
The same also works with label images
from skimage.measure import label
labels = label(binary)
stackview.curtain(slice_image, labels)
Blend
You can blend images interactively like this:
stackview.blend(image, label_image)
Side-by-side view
A side-by-side view for colocalization visualization is also available. If you're working with time-lapse data, you can also use this view for visualizing differences between timepoints:
stackview.side_by_side(image_stack[1:], image_stack[:-1])
Switch
The switch function allows to switch between a list or dictionary of images.
stackview.switch([
    slice_image,
    binary,
    labels
])
Switch toggleable
You can also view multiple channels with different colormaps at the same time using the toggleable parameter of switch.
It is recommended to also pass a list of colormaps. Colormap names can be taken from Matplotlib and stackview aims at compatibility with microfilm.
hela_cells = imread("data/hela-cells.tif")

stackview.switch(
    {"lysosomes":   hela_cells[:,:,0],
     "mitochondria":hela_cells[:,:,1],
     "nuclei":      hela_cells[:,:,2]
    },
    colormap=["pure_magenta", "pure_green", "pure_blue"],
    toggleable=True
)
nD-Viewer
You can also use all functions above with n-dimensional data (since stackview 0.10.0). You will then see multiple sliders for navigating through dimensions such as space and time.
In case you work with multiple channels, using stackview.switch() with toggleable=True is recommended (Read more).
Crop
You can crop images interactively:
crop_widget = stackview.crop(image_stack)
crop_widget
... and retrieve the crop range as a tuple of slice objects:
r = crop_widget.range
r
Output:
(slice(0, 40, 1), slice(40, 80, 1), slice(80, 120, 1))
... or you can crop the image directly:
cropped_image = crop_widget.crop()
cropped_image.shape
Output:
(40, 40, 40)
Bounding boxes
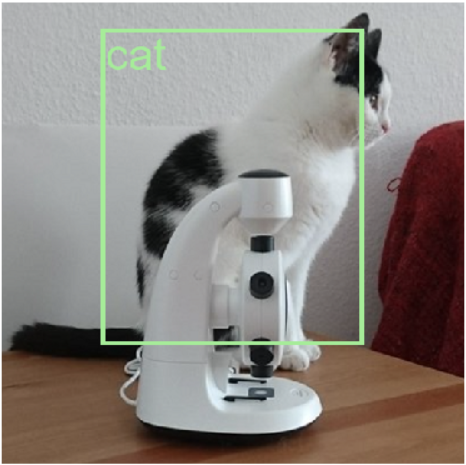
You can draw bounding boxes into images using the add_bounding_boxes function.
The bounding boxes are defined as a list of dictionaries, each with 'x', 'y', 'width', 'height' keys, optional also 'color' and 'description'.
If you work with nD data, you can also pass a list of bounding boxes for each slice. Read more).
cat = imread("data/real_cat.png")
bb = {'x': 110, 'y': 30, 'width': 290, 'height': 350, 'color': 'lightgreen', 'description':'cat', 'font_size':50}

stackview.add_bounding_boxes(cat, [bb])
scatterplot and clusterplot
Using stackview.scatterplot() you can create interactive plots for pandas DataFrames (full example).
stackview.scatterplot(df, 'area', 'feret_diameter_max', "selection", figsize=(5,4))
If you want to visualize such a DataFrame side-by-side with the label image its measurements belong to, you can use the
clusterplot:
stackview.clusterplot(image=image,
                     labels=labeled_image,
                     df=df,
                     column_x="area",
                     column_y="aspect_ratio",
                     zoom_factor=1.6,
                     alpha=0.7)
This functionality is inspired from the napari-clusters-plotter.

Sliceplot
Another similar interactive plot is the sliceplot: In case you have a pandas DataFrame with a columns representing measurements of slices in an image stack, you can use this function to visualize the slices in a plot.
stackview.sliceplot(df, images, column_x="UMAP0", column_y="UMAP1")

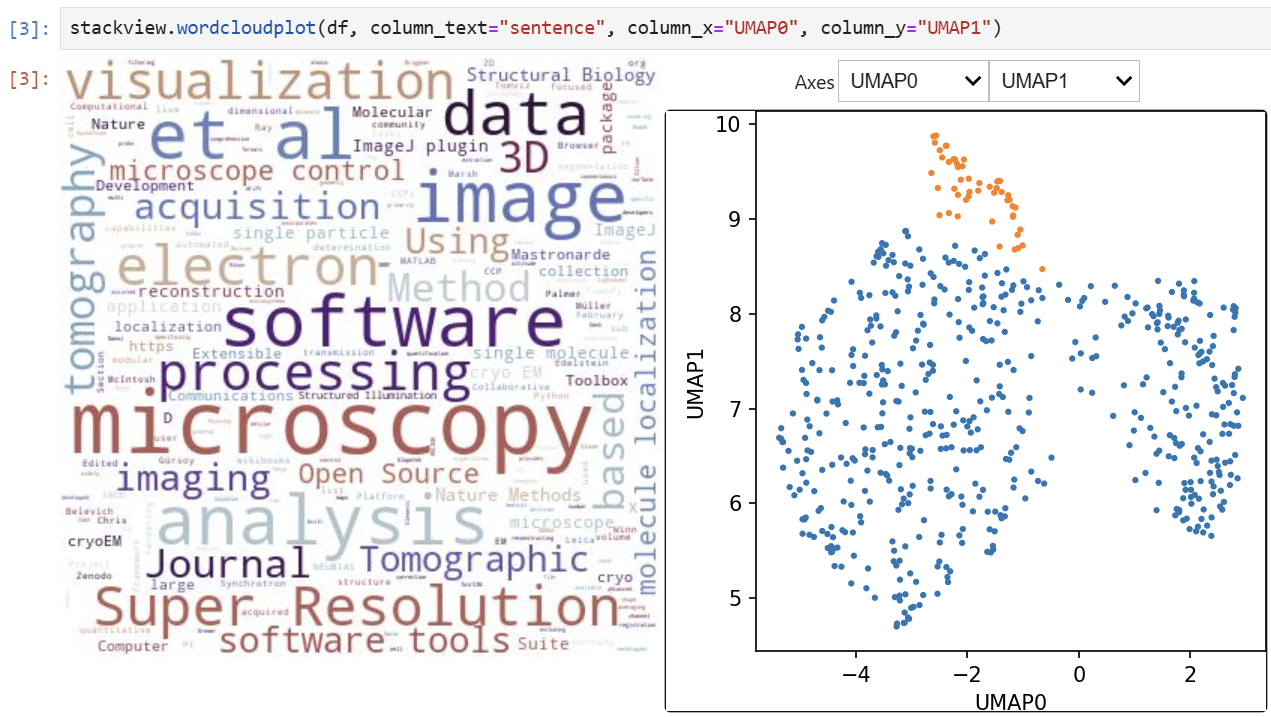
Wordcloudplot
If you have a pandas DataFrame with a column containing text and additionally numeric columns related to the text, you can use the wordcloudplot function to visualize selected texts in a wordcloud.
Interact
Exploration of the parameter space of image processing functions is available using interact:
from skimage.filters.rank import maximum
stackview.interact(maximum, slice_image)
This might be useful for custom functions implementing image processing workflows:
from skimage.filters import gaussian, threshold_otsu, sobel
def my_custom_code(image, sigma:float = 1, show_labels: bool = True):
    sigma = abs(sigma)
    blurred_image = gaussian(image, sigma=sigma)
    binary_image = blurred_image > threshold_otsu(blurred_image)
    edge_image = sobel(binary_image)

    if show_labels:
        return label(binary_image)
    else:
        return edge_image * 255 + image

stackview.interact(my_custom_code, slice_image)

If you want to use a pulldown for selecting input image(s), you need to pass a dictionary of (name, image) pairs as context, e.g. context=globals():
image1 = imread("data/Haase_MRT_tfl3d1.tif")
image2 = image1[:,:,::-1]

stackview.interact(gaussian, context=globals())
To add an insight-view automatically to results of functions, you can add this.
@jupyter_displayable_output
def my_gaussian(image, sigma):
    return gaussian(image, sigma)

my_gaussian(image[60], 2)
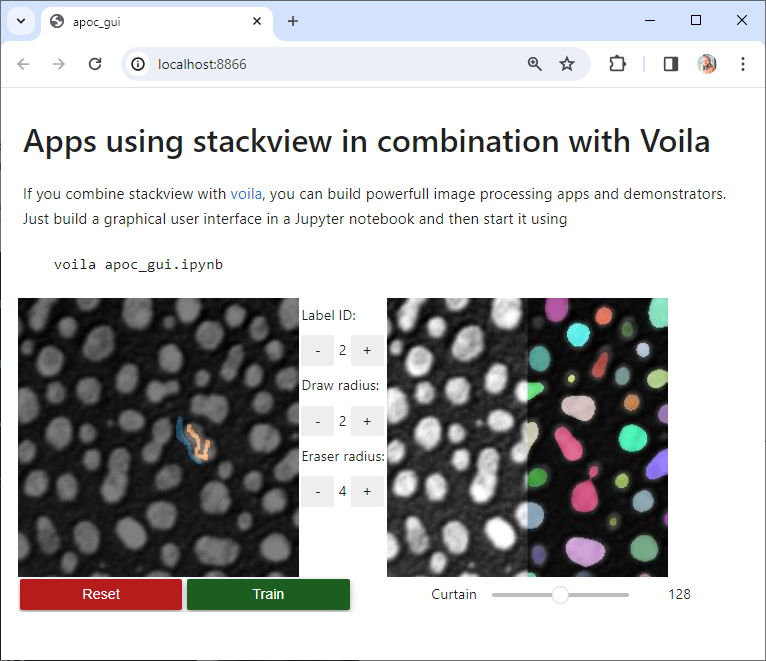
Voila
If you combine stackview with voila, you can build powerful, interactive, browser-based image processing apps and demonstrators. Just build a graphical user interface in a Jupyter notebook and then start it using
Contributing
Contributions, bug-reports and ideas for further development are very welcome.
License
Distributed under the terms of the BSD-3 license, "stackview" is free and open source software
Issues
If you encounter any problems, please create a thread on image.sc along with a detailed description and tag @haesleinhuepf.
See also
There are other libraries doing similar stuff
Release history Release notifications | RSS feed


Download files
Download the file for your platform. If you're not sure which to choose, learn more about installing packages.
Source Distribution
Built Distribution
Filter files by name, interpreter, ABI, and platform.
If you're not sure about the file name format, learn more about wheel file names.
Copy a direct link to the current filters
File details
Details for the file stackview-0.19.1.tar.gz.
File metadata
- Download URL: stackview-0.19.1.tar.gz
- Upload date:
- Size: 44.2 kB
- Tags: Source
- Uploaded using Trusted Publishing? No
- Uploaded via: twine/6.2.0 CPython/3.14.2
File hashes
| Algorithm | Hash digest | |
|---|---|---|
| SHA256 |
3aef8dee10fc5882cdb8618e76f7652c53fbcc62a39fb0b952375bad2ffcb51f
|
|
| MD5 |
bb3770f3ed3fa4888fd0c815e585b7c2
|
|
| BLAKE2b-256 |
3805934e307fe070bab6d9b7ba33b29580e017dbc57efc30c3e182f683d4452b
|
File details
Details for the file stackview-0.19.1-py3-none-any.whl.
File metadata
- Download URL: stackview-0.19.1-py3-none-any.whl
- Upload date:
- Size: 55.3 kB
- Tags: Python 3
- Uploaded using Trusted Publishing? No
- Uploaded via: twine/6.2.0 CPython/3.14.2
File hashes
| Algorithm | Hash digest | |
|---|---|---|
| SHA256 |
e36abba105d498a569ee272e4667b2aecd9c2de5336f4602fd3809d8d09c7c2d
|
|
| MD5 |
6e23e121eb41e5ad4c0b23a6cb9d2b30
|
|
| BLAKE2b-256 |
42b60a799ed537299f5b6682dc93c6403ea6b987e2821e1f866cd94b1ab1f726
|


