Drop-in monitoring for GenAI applications

Project description
stakeout-agent
Drop-in monitoring for LangGraph applications. Captures every graph run, node execution, and tool call into MongoDB or PostgreSQL with no changes to your graph code.
Why stakeout-agent?
When building LangGraph applications, understanding how your graphs execute is critical for debugging and optimization. stakeout-agent provides:
- Zero code changes — just add a callback to your graph config
- Complete visibility — captures node starts/ends, tool calls, and errors
- Resilient by default — database failures are logged and never crash your application
- MongoDB or PostgreSQL — use whichever fits your existing infrastructure
- Framework-agnostic core — easily extensible to other frameworks
Installation
# MongoDB backend (default)
pip install stakeout-agent

# PostgreSQL backend
pip install 'stakeout-agent[postgres]'
Requires Python 3.10+ and a running MongoDB or PostgreSQL instance.
Quick start
Sync (graph.invoke)
from stakeout_agent import LangGraphMonitorCallback

monitor = LangGraphMonitorCallback(graph_id="my_graph", thread_id="thread_123")
result = graph.invoke(inputs, config={"callbacks": [monitor]})
Async (graph.ainvoke / graph.astream)
from stakeout_agent import AsyncLangGraphMonitorCallback

monitor = AsyncLangGraphMonitorCallback(graph_id="my_graph", thread_id="thread_123")
result = await graph.ainvoke(inputs, config={"callbacks": [monitor]})
Try the example
Run the example graph
A self-contained example graph is included to verify everything is wired up correctly.
Start MongoDB, then run:
docker compose up -d mongo
cd stakeout-agent
uv run python examples/dummy_app.py
It runs a three-node graph (with a tool call), then prints the runs and events documents written to MongoDB so you can confirm monitoring is working before integrating into your own application.
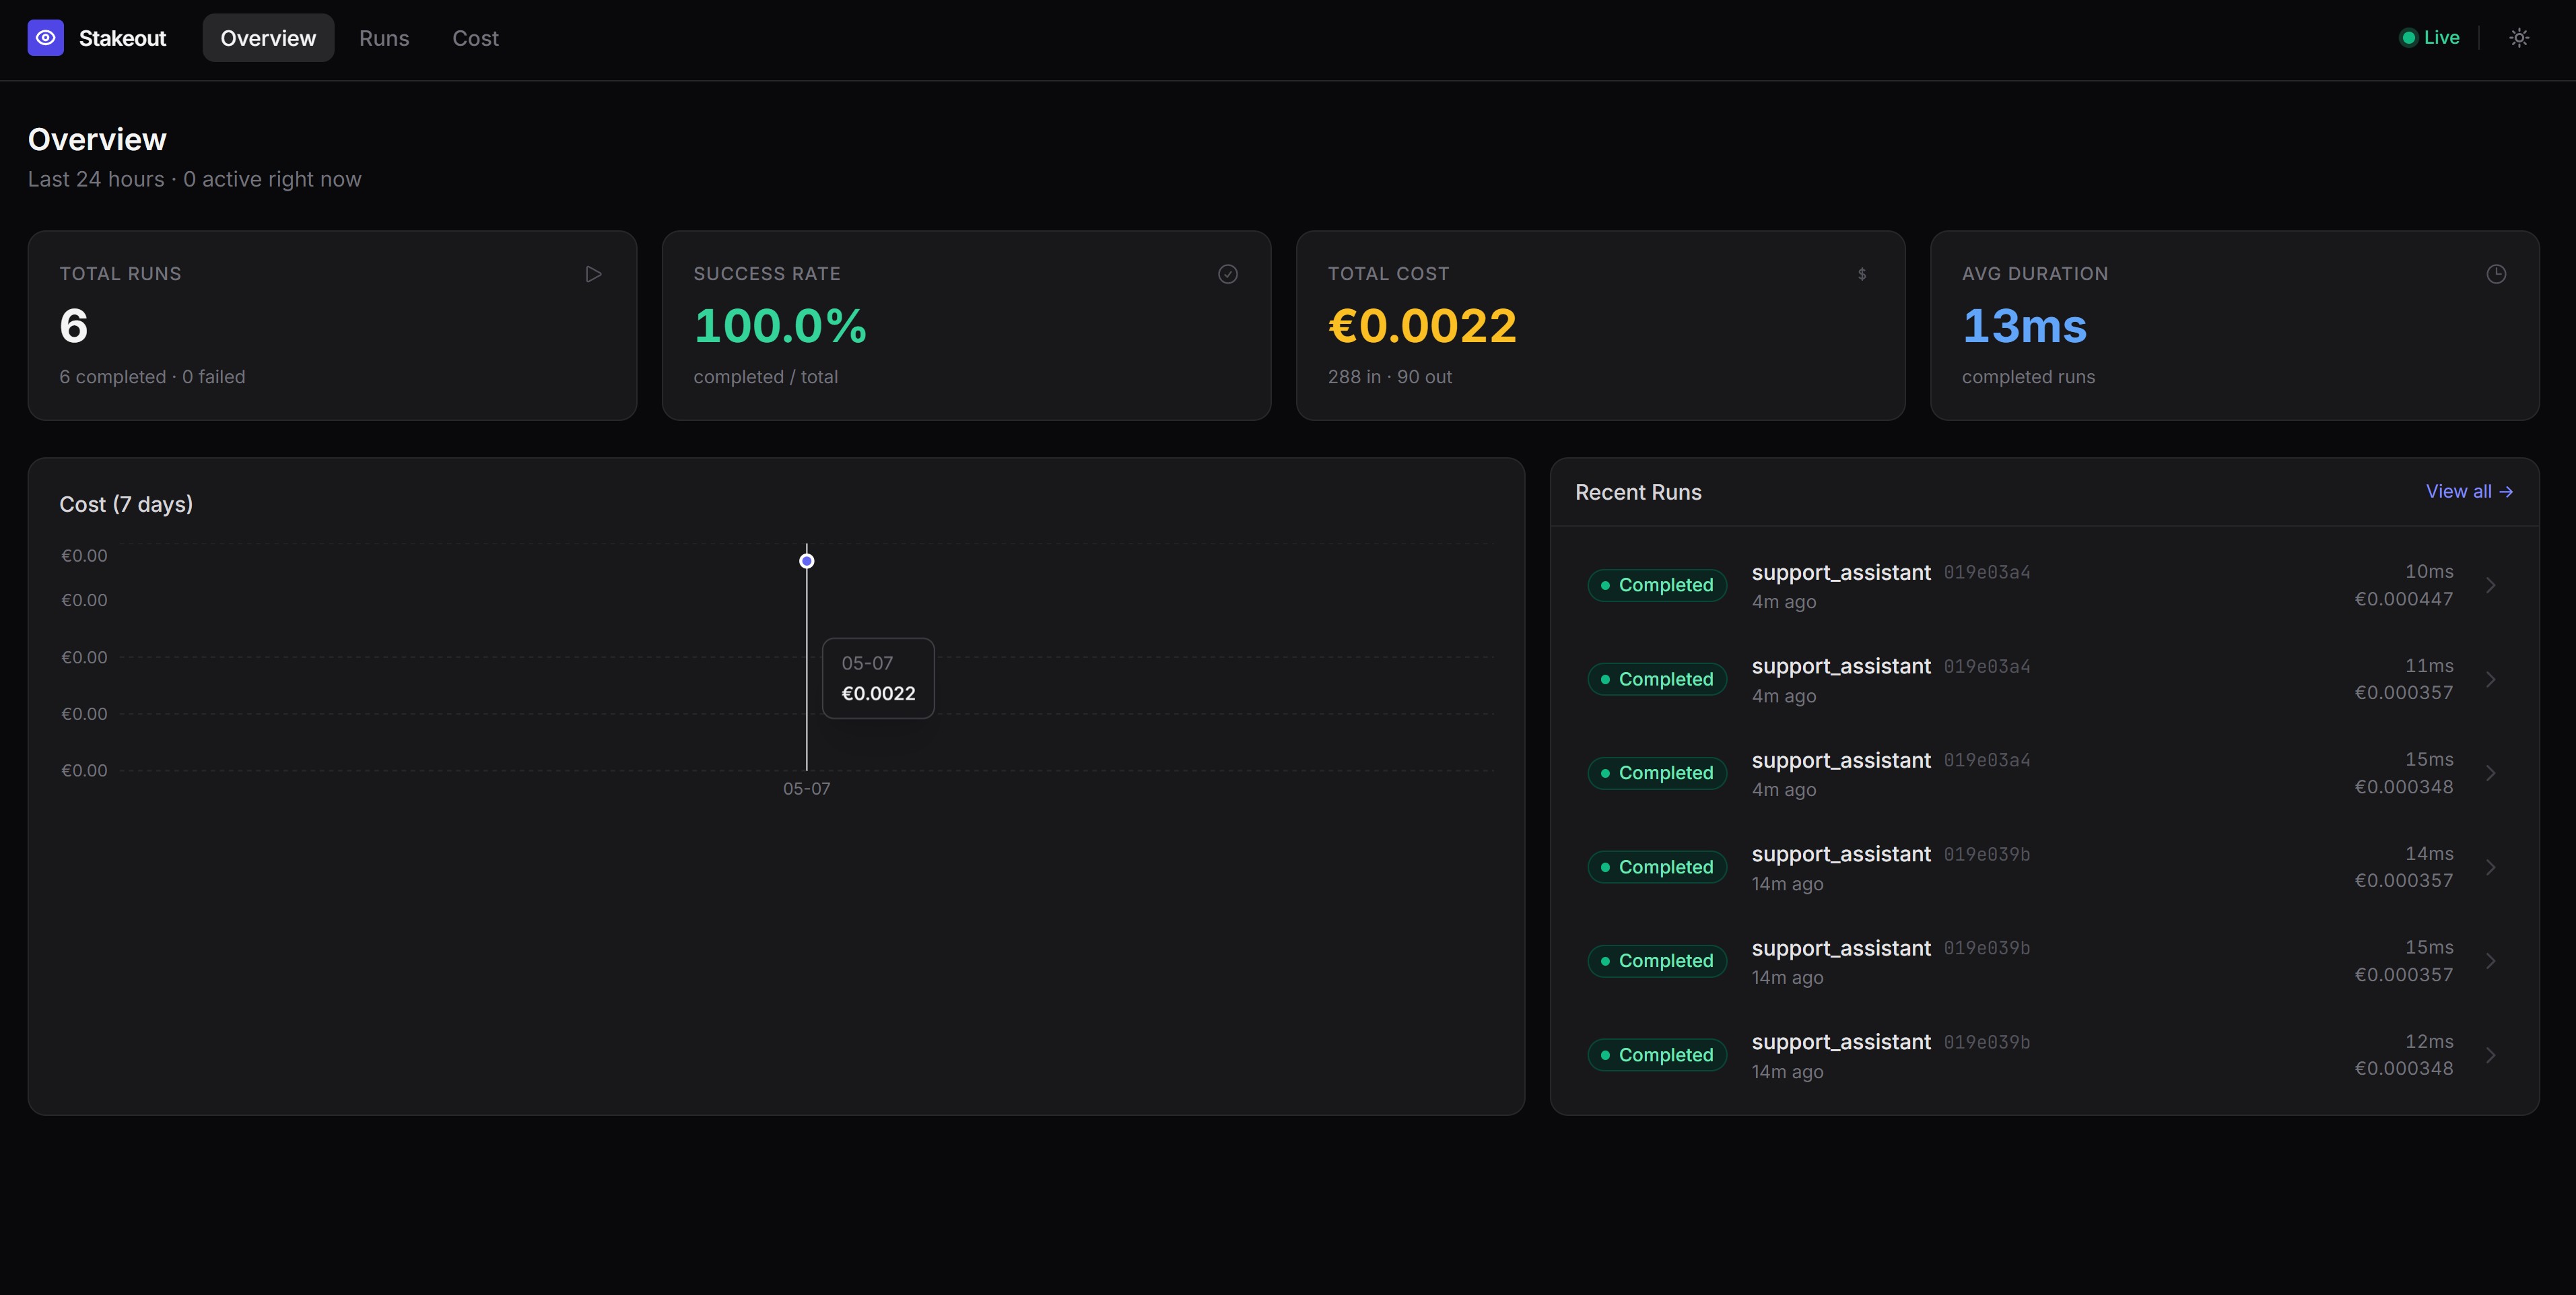
Launch the dashboard
A Streamlit dashboard is included to visualise runs, node execution timelines, and tool call details.
Optionally seed demo data first, then start the dashboard:
docker compose up -d mongo
cd stakeout-agent
uv run python examples/seed_demo_data.py   # optional: load demo data
uv run --with streamlit streamlit run examples/dashboard.py
Open http://localhost:8501 in your browser. The dashboard auto-refreshes every 10 seconds and shows:
- Run History — recent runs, status, duration, and a runs-over-time chart
- Node Performance — average and P95 latency per node and tool, error counts
- Run Inspector — full event timeline for any individual run
- Thread Deep Dive — multi-turn conversation view across all runs in a thread
Configuration
| Environment variable | Default | Description |
|---|---|---|
STAKEOUT_BACKEND |
mongodb |
Backend to use: mongodb or postgres |
MONGO_URI |
mongodb://localhost:27017 |
MongoDB connection string |
MONGO_DB |
stakeout |
MongoDB database name |
POSTGRES_URI |
postgresql://localhost/stakeout |
PostgreSQL connection string (also reads DATABASE_URL) |
Using the PostgreSQL backend
Set STAKEOUT_BACKEND=postgres and provide a connection string:
export STAKEOUT_BACKEND=postgres
export POSTGRES_URI=postgresql://user:password@localhost/stakeout
stakeout-agent automatically creates the runs and events tables on first connection, so no migration is needed.
To start a local PostgreSQL instance for development:
docker compose up -d postgres
The connection string for the Docker service is postgresql://stakeout:stakeout@localhost/stakeout.
You can also pass a backend instance directly to skip environment-variable routing:
from stakeout_agent import LangGraphMonitorCallback, PostgresMonitorDB

monitor = LangGraphMonitorCallback(
    graph_id="my_graph",
    thread_id="thread_123",
    db=PostgresMonitorDB(),
)
What gets recorded
runs collection
One document per graph invocation.
{
  "_id": "<run_id>",
  "graph_id": "my_graph",
  "thread_id": "thread_123",
  "status": "completed",
  "started_at": "2026-04-25T10:00:00Z",
  "ended_at": "2026-04-25T10:00:05Z",
  "error": null,
  "metadata": {}
}
status is one of running, completed, or failed.
events collection
One document per node start/end, tool call, or error within a run.
Start events:
{
  "run_id": "<run_id>",
  "graph_id": "my_graph",
  "event_type": "node_start",
  "node_name": "agent",
  "timestamp": "2026-04-25T10:00:02Z",
  "payload": {"inputs": "..."},
  "error": null
}
End events include a latency_ms field measuring execution time:
{
  "run_id": "<run_id>",
  "graph_id": "my_graph",
  "event_type": "node_end",
  "node_name": "agent",
  "timestamp": "2026-04-25T10:00:03Z",
  "latency_ms": 1240.5,
  "payload": {"outputs": "..."},
  "error": null
}
event_type |
When | latency_ms |
|---|---|---|
node_start |
A graph node begins execution | absent |
node_end |
A graph node completes | present |
tool_call |
A tool is invoked | absent |
tool_result |
A tool returns a result | present |
error |
A node or tool raises an exception | present |
Error handling
All database write operations catch errors and log the failure rather than propagating the exception. A monitoring failure will never take down your application. Enable DEBUG logging on stakeout_agent to see these errors:
import logging
logging.getLogger("stakeout_agent").setLevel(logging.DEBUG)
Using the database backends directly
MongoDB
from stakeout_agent import MonitorDB

db = MonitorDB()

# fetch all runs for a graph
runs = list(db.runs.find({"graph_id": "my_graph"}).sort("started_at", -1))

# fetch events for a specific run
events = list(db.events.find({"run_id": "<run_id>"}).sort("timestamp", 1))
PostgreSQL
from stakeout_agent import PostgresMonitorDB
import psycopg2

db = PostgresMonitorDB()

# fetch all runs for a graph (use a raw psycopg2 connection for queries)
conn = psycopg2.connect("postgresql://user:password@localhost/stakeout")
with conn.cursor() as cur:
    cur.execute("SELECT * FROM runs WHERE graph_id = %s ORDER BY started_at DESC", ("my_graph",))
    runs = cur.fetchall()
Package structure
stakeout_agent/
├── backends/
│   ├── base.py        # AbstractMonitorDB — shared interface
│   ├── postgres.py    # PostgresMonitorDB
│   └── __init__.py    # get_backend() factory
├── callback_handler/
│   ├── base.py        # _MonitorBase — framework-agnostic core logic
│   ├── langgraph.py   # LangGraphMonitorCallback, AsyncLangGraphMonitorCallback
│   └── __init__.py
└── db.py              # MonitorDB (MongoDB)
To add support for another LLM framework, create a file under callback_handler/ that inherits from _MonitorBase and implements the target framework's callback protocol.
To add support for another database, create a class that inherits from AbstractMonitorDB and implement the four methods: create_run, complete_run, fail_run, and insert_event.
Dashboard
The recorded data can power a dashboard to visualize graph runs, node execution timelines, and tool call details:
License
MIT
Release history Release notifications | RSS feed


Download files
Download the file for your platform. If you're not sure which to choose, learn more about installing packages.
Source Distribution
Built Distribution
Filter files by name, interpreter, ABI, and platform.
If you're not sure about the file name format, learn more about wheel file names.
Copy a direct link to the current filters
File details
Details for the file stakeout_agent-0.0.4.tar.gz.
File metadata
- Download URL: stakeout_agent-0.0.4.tar.gz
- Upload date:
- Size: 14.2 kB
- Tags: Source
- Uploaded using Trusted Publishing? No
- Uploaded via: uv/0.6.2
File hashes
| Algorithm | Hash digest | |
|---|---|---|
| SHA256 |
7340040255ff93ac3352c0e75219b94ebfcc7a4b65ddb252b68fd30935207587
|
|
| MD5 |
c71f30ba7cdd38ed581df1d4425e706a
|
|
| BLAKE2b-256 |
5fe5738e32bf620ad3af46f5a7790c7f3260a1a585728d12ea152bc9b9f53afd
|
File details
Details for the file stakeout_agent-0.0.4-py3-none-any.whl.
File metadata
- Download URL: stakeout_agent-0.0.4-py3-none-any.whl
- Upload date:
- Size: 11.3 kB
- Tags: Python 3
- Uploaded using Trusted Publishing? No
- Uploaded via: uv/0.6.2
File hashes
| Algorithm | Hash digest | |
|---|---|---|
| SHA256 |
46caf07bc3ce7439a7cc3d2422074b19be4ae877cac767971ef106488bf946c4
|
|
| MD5 |
a98e9a4eef4a16b3a215e81bf8b1c60a
|
|
| BLAKE2b-256 |
99a84a35be6f4094037746eba1a133d1c803030cf52bca54309825db82cf5ac2
|


