
streamlit-sigmajs



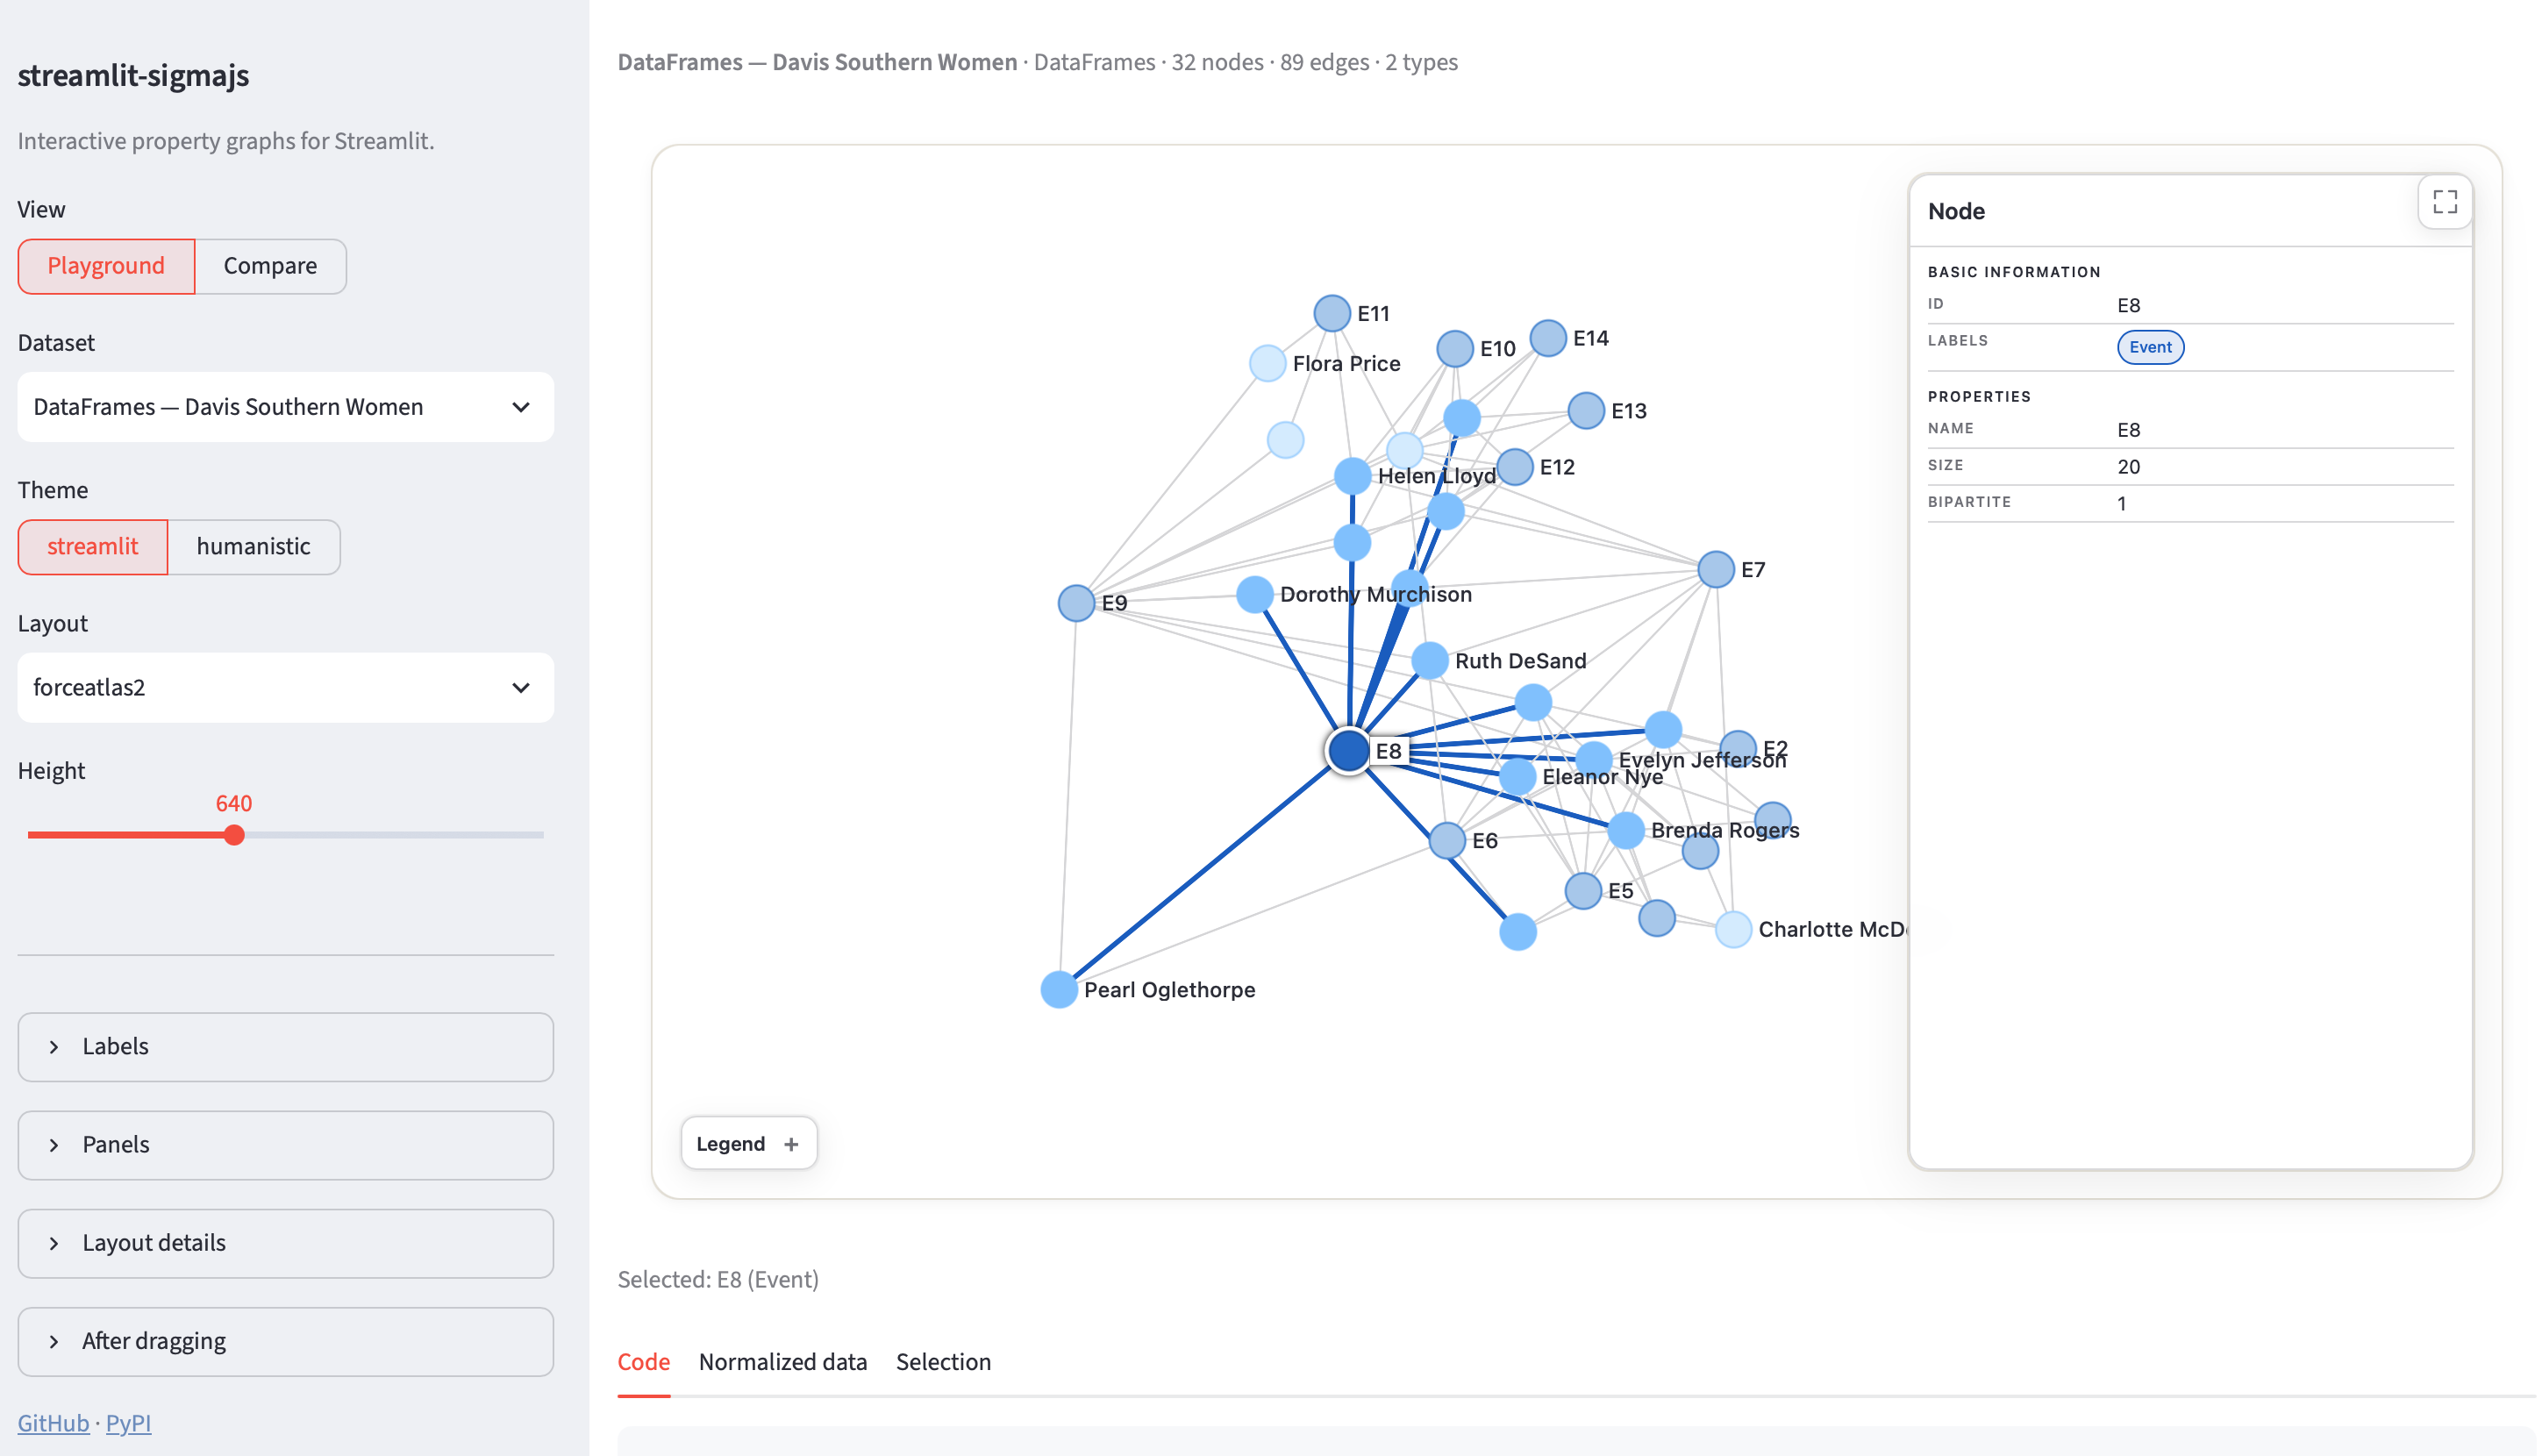
Interactive property-graph visualization for Streamlit, powered by Sigma.js. Pass a property-graph dictionary, NetworkX graph, Neo4j graph result, or pair of pandas DataFrames directly from Python.
Features
- Direct NetworkX, Neo4j, DataFrame, and property-graph inputs
- Streamlit-native and warm humanistic themes
- Explicit property mappings for node size, color, label, and coordinates — properties stay application data until you opt one into rendering
- Node and edge click events plus persistent selection state returned to Python
- Node and edge selection with compact property inspectors
- Configurable labels, legend, colors, fonts, and interaction behavior
- In-page graph expansion over the browser viewport, closed with Escape
- ForceAtlas2, force, circular, circlepack, grid, concentric, hierarchical, random, and pre-positioned layouts
- Real-time spring physics while dragging: nearby nodes respond immediately,
then settle around the pinned dropped node without replacing the initial
layout; disable it with
LayoutConfig(dynamic_after_drag=False) - Multiple independent graphs on the same Streamlit page
Requirements
- Python 3.10 or newer
- Streamlit 1.51 or newer
No JavaScript or frontend setup is required when installing the package from PyPI.
Installation
With uv:
uv add streamlit-sigmajs
With pip:
python -m pip install streamlit-sigmajs
NetworkX, pandas, and the Neo4j driver are optional. Install only the library used by your application.
Quick start
Create app.py:
import streamlit as st
from st_sigma import sigma_graph

st.title("Knowledge graph")

graph = {
    "nodes": [
        {
            "id": "ada",
            "labels": ["Person"],
            "properties": {"name": "Ada Lovelace", "born": 1815},
        },
        {
            "id": "notes",
            "labels": ["Work"],
            "properties": {"name": "Notes on the Analytical Engine"},
        },
    ],
    "edges": [
        {
            "id": "authored",
            "source": "ada",
            "target": "notes",
            "type": "AUTHORED",
            "properties": {"year": 1843},
            "directed": True,
        }
    ],
}

sigma_graph(graph, height=600, key="knowledge-graph")
Run it with uv:
uv run streamlit run app.py
Or with pip:
streamlit run app.py
The default streamlit theme follows the host app's colors. Click a node or
edge to inspect its properties, drag nodes to reposition them, and use the
mouse wheel or trackpad to zoom.
Supported graph inputs
NetworkX
Pass any NetworkX Graph, DiGraph, MultiGraph, or MultiDiGraph. Node
attributes become properties. The label or labels attribute sets the node
type, while an edge's type attribute sets its relationship type.
import networkx as nx
from st_sigma import sigma_graph

graph = nx.karate_club_graph()
sigma_graph(graph, layout="forceatlas2", key="karate")
Install NetworkX with uv add networkx or python -m pip install networkx.
pandas DataFrames
Pass the node DataFrame first and the edge DataFrame through edges=. Nodes
require an id column; edges require source and target. The conventional
optional columns are label or labels for nodes and id, type, and
directed for edges. All remaining columns become properties.
import pandas as pd
from st_sigma import sigma_graph

nodes = pd.DataFrame([
    {"id": "ada", "label": "Person", "name": "Ada Lovelace"},
    {"id": "notes", "label": "Work", "name": "Analytical Engine Notes"},
])
edges = pd.DataFrame([
    {"id": "r1", "source": "ada", "target": "notes", "type": "AUTHORED"},
])

sigma_graph(nodes, edges=edges, theme="humanistic", key="dataframes")
Install pandas with uv add pandas or python -m pip install pandas.
Neo4j
neo4j.Result.graph output can be passed directly; no conversion helper is
needed.
import neo4j
from neo4j import GraphDatabase
from st_sigma import sigma_graph

with GraphDatabase.driver(NEO4J_URI, auth=NEO4J_AUTH) as driver:
    graph = driver.execute_query(
        "MATCH (a)-[r]->(b) RETURN a, r, b LIMIT 100",
        result_transformer_=neo4j.Result.graph,
    )

sigma_graph(graph, height=650, key="neo4j")
Install the driver with uv add neo4j or python -m pip install neo4j.
Property-graph dictionaries
The canonical schema is:
graph = {
    "nodes": [
        {
            "id": "node-id",
            "labels": ["NodeType"],
            "properties": {"name": "Visible label", "any_key": "any value"},
        }
    ],
    "edges": [
        {
            "id": "edge-id",
            "source": "source-node-id",
            "target": "target-node-id",
            "type": "RELATIONSHIP_TYPE",
            "properties": {},
            "directed": True,
        }
    ],
}
Legacy dictionaries using identity, relationships, start, and end are
also normalized automatically.
Themes and layouts
Use a preset for common cases:
sigma_graph(graph, theme="humanistic", layout="circular")
Themes:
streamlit— neutral styling that follows Streamlit theme variableshumanistic— warm surfaces and a muted, low-saturation palette
Layouts:
forceatlas2forcecircularcirclepackgridconcentrichierarchicalrandomnone— preserve coordinates selected withnode_x_fieldandnode_y_field
Display and interaction configuration
Most applications only need sigma_graph(...). Use GraphConfig when more
control is required:
from st_sigma import DisplayConfig, GraphConfig, LayoutConfig, sigma_graph

config = GraphConfig(
    display=DisplayConfig(
        node_size_mode="auto",     # "auto" | "fixed"
        node_size=10,
        node_size_field="weight",  # optional numeric property mapping
        node_color_field="category",  # optional categorical property mapping
        node_label_field="name",   # property used for visible node labels
        node_labels="hover",       # "auto" | "hover" | "hidden"
        edge_labels="hover",       # "always" | "hover" | "hidden"
        node_label_size=11,
        edge_label_size=8,
        label_density=0.8,                 # only used when node_labels="auto"
        label_rendered_size_threshold=6,   # only used when node_labels="auto"
        properties_panel="compact",  # "compact" | "cards" | "hidden"
        show_legend=True,
        legend_collapsed=True,
        show_fullscreen_button=True,
        selection_dimming=0.68,
        hide_edges_on_move=False,  # hide edges while panning or zooming
    ),
    layout=LayoutConfig(
        name="forceatlas2",
        node_x_field=None,          # set with node_y_field for pre-positioned data
        node_y_field=None,
        iterations=120,
        dynamic_after_drag=True,
        drag_relaxation_ms=1000,    # maximum post-release settling time
    ),
)

sigma_graph(graph, config=config, key="configured-graph")
Hierarchical layouts accept hierarchy_direction="TB", "BT", "LR", or
"RL".
With node_labels="auto", Sigma decides how many labels fit on screen. Lower
label_density (0 to 1, default 0.8) to thin out labels on crowded
graphs, and raise label_rendered_size_threshold (default 6) so that only
nodes drawn above that pixel size are labeled — a useful pairing with
node_size_field when you want just the hubs named. Both settings are ignored
when node_labels is "hover" or "hidden".
To use a locally installed font, set label_font_family. For Google Fonts or a
self-hosted @font-face stylesheet, also provide its CSS URL:
display = DisplayConfig(
    label_font_family="'IBM Plex Sans', sans-serif",
    label_font_url=(
        "https://fonts.googleapis.com/css2?"
        "family=IBM+Plex+Sans:wght@400;500;600&display=swap"
    ),
)
Automatic node sizing is enabled by default. It scales nodes down for dense
graphs and narrow components while treating node_size as the maximum default
size. Set node_size_mode="fixed" to use the configured size at every
component width. Properties are always preserved as application data; set
node_size_field, node_color_field, node_label_field, node_x_field, or
node_y_field when you explicitly want a property to control rendering.
Visible node labels read only node_label_field, which defaults to name, and
fall back to the node ID when the property is missing. Graphs that carry their
display text under another key must set the field explicitly, for example
DisplayConfig(node_label_field="title"). Node colors follow the primary node
label unless node_color_field names a categorical property.
The returned component result exposes interaction state. result.clicked is a
one-rerun event with {"type": "node" | "edge", "id": ...}, while
result.selection persists the current nodes and edges arrays. Optional
on_clicked_change and on_selection_change callbacks follow Streamlit's v2
component callback convention.
Run the example gallery
The repository includes a two-view example app. Playground pairs sidebar controls for datasets, themes, layouts, property mappings, and display options with the generated code, the underlying data, and live click and selection state. Compare shows four task-oriented scenarios side by side — knowledge graph, influence and hubs, categorical mapping, and clean topology — each built on a different input type, with one click to load its settings into the Playground.
Clone the repository, then run it with uv:
git clone https://github.com/gitkeniwo/streamlit-sigmajs.git
cd streamlit-sigmajs
uv sync --extra examples
uv run streamlit run examples/app.py
Or create an editable environment with pip:
git clone https://github.com/gitkeniwo/streamlit-sigmajs.git
cd streamlit-sigmajs
python -m venv .venv
source .venv/bin/activate  # Windows: .venv\Scripts\activate
python -m pip install -e ".[examples]"
streamlit run examples/app.py
Downloaded datasets are stored in the ignored examples/data/ directory.
See the
example gallery notes
for dataset sources and optional data preparation commands.
Compatibility
The v0.1 st_sigmagraph(graphData=...) entry point remains available for
existing applications. New code should use sigma_graph(...).
Two behaviors changed since 0.2.0:
- Node labels no longer fall back through
name,label, andtitle. SetDisplayConfig(node_label_field=...)when your display text lives elsewhere. - Duplicate node or edge IDs and edges pointing at missing nodes now raise
ValueErrorinstead of being rendered partially.
License
1 maintainer

Download files
Download the file for your platform. If you're not sure which to choose, learn more about installing packages.
Source Distribution
Built Distribution
Filter files by name, interpreter, ABI, and platform.
If you're not sure about the file name format, learn more about wheel file names.
Copy a direct link to the current filters
File details
Details for the file streamlit_sigmajs-0.3.0.tar.gz.
File metadata
- Download URL: streamlit_sigmajs-0.3.0.tar.gz
- Upload date:
- Size: 171.7 kB
- Tags: Source
- Uploaded using Trusted Publishing? Yes
- Uploaded via: twine/7.0.0 CPython/3.13.14
File hashes
| Algorithm | Hash digest | |
|---|---|---|
| SHA256 |
aee5a127e13d461a9e7cf29b3d3d802e616c2d3128fc5e09882e699da5d9201f
|
|
| MD5 |
058c74320c49097ee8c1eb0822ba6ccd
|
|
| BLAKE2b-256 |
c989443ce558b41fb784e0964296f2c6c5f0b3787467e7b9f47691149c9a2eb6
|
Provenance
The following attestation bundles were made for streamlit_sigmajs-0.3.0.tar.gz:
Publisher:
publish.yml on gitkeniwo/streamlit-sigmajs
-
Statement:
-
Statement type:
https://in-toto.io/Statement/v1 -
Predicate type:
https://docs.pypi.org/attestations/publish/v1 -
Subject name:
streamlit_sigmajs-0.3.0.tar.gz -
Subject digest:
aee5a127e13d461a9e7cf29b3d3d802e616c2d3128fc5e09882e699da5d9201f - Sigstore transparency entry: 2468751520
- Sigstore integration time:
-
Permalink:
gitkeniwo/streamlit-sigmajs@229dc3b8d4eebb055344960aa0f956d2396d5eeb -
Branch / Tag:
refs/tags/v0.3.0 - Owner: https://github.com/gitkeniwo
-
Access:
public
-
Token Issuer:
https://token.actions.githubusercontent.com -
Runner Environment:
github-hosted -
Publication workflow:
publish.yml@229dc3b8d4eebb055344960aa0f956d2396d5eeb -
Trigger Event:
push
-
Statement type:
File details
Details for the file streamlit_sigmajs-0.3.0-py3-none-any.whl.
File metadata
- Download URL: streamlit_sigmajs-0.3.0-py3-none-any.whl
- Upload date:
- Size: 164.8 kB
- Tags: Python 3
- Uploaded using Trusted Publishing? Yes
- Uploaded via: twine/7.0.0 CPython/3.13.14
File hashes
| Algorithm | Hash digest | |
|---|---|---|
| SHA256 |
c345ec944d873f52f0c8ec7601cc00c64ce540d1ae9964474cff4b1b3fced160
|
|
| MD5 |
33d748d0cfebe1a1d5b093ce68ad0ee2
|
|
| BLAKE2b-256 |
1563a37f92e151d18aaac7247704489f09793610377bc53abbd239cab886a4dc
|
Provenance
The following attestation bundles were made for streamlit_sigmajs-0.3.0-py3-none-any.whl:
Publisher:
publish.yml on gitkeniwo/streamlit-sigmajs
-
Statement:
-
Statement type:
https://in-toto.io/Statement/v1 -
Predicate type:
https://docs.pypi.org/attestations/publish/v1 -
Subject name:
streamlit_sigmajs-0.3.0-py3-none-any.whl -
Subject digest:
c345ec944d873f52f0c8ec7601cc00c64ce540d1ae9964474cff4b1b3fced160 - Sigstore transparency entry: 2468751558
- Sigstore integration time:
-
Permalink:
gitkeniwo/streamlit-sigmajs@229dc3b8d4eebb055344960aa0f956d2396d5eeb -
Branch / Tag:
refs/tags/v0.3.0 - Owner: https://github.com/gitkeniwo
-
Access:
public
-
Token Issuer:
https://token.actions.githubusercontent.com -
Runner Environment:
github-hosted -
Publication workflow:
publish.yml@229dc3b8d4eebb055344960aa0f956d2396d5eeb -
Trigger Event:
push
-
Statement type:







