
tableone
tableone is a package for creating "Table 1" summary statistics for a patient population. It was inspired by the R package of the same name by Yoshida and Bohn.




Suggested citation
If you use tableone in your study, please cite the following paper:
Tom J Pollard, Alistair E W Johnson, Jesse D Raffa, Roger G Mark; tableone: An open source Python package for producing summary statistics for research papers, JAMIA Open, https://doi.org/10.1093/jamiaopen/ooy012
Documentation
For documentation, see: http://tableone.readthedocs.io/en/latest/. An executable demonstration of the package is available on GitHub as a Jupyter Notebook. The easiest way to try out this notebook is to open it in Google Colaboratory. A paper describing our motivations for creating the package is available at: https://doi.org/10.1093/jamiaopen/ooy012.
A note for users of tableone
While we have tried to use best practices in creating this package, automation of even basic statistical tasks can be unsound if done without supervision. We encourage use of tableone alongside other methods of descriptive statistics and, in particular, visualization to ensure appropriate data handling.
It is beyond the scope of our documentation to provide detailed guidance on summary statistics, but as a primer we provide some considerations for choosing parameters when creating a summary table at: http://tableone.readthedocs.io/en/latest/bestpractice.html.
Guidance should be sought from a statistician when using tableone for a research study, especially prior to submitting the study for publication.
Overview
At a high level, you can use the package as follows:
- Import the data into a pandas DataFrame
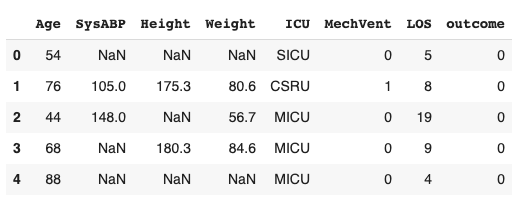
- Run tableone on this dataframe to output summary statistics
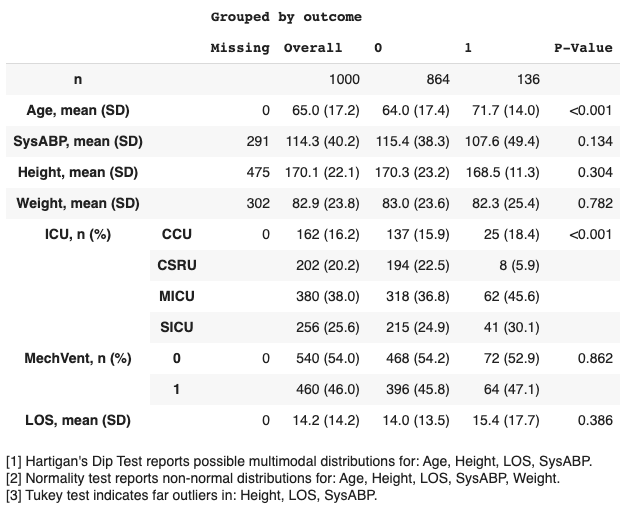
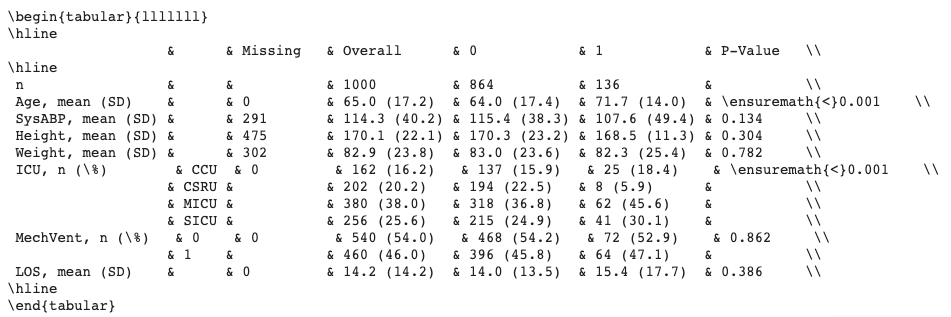
- Specify your desired output format: text, latex, markdown, etc.
Additional options include:
- Select a subset of columns.
- Specify the data type (e.g.
categorical,numerical,nonnormal). - Compute p-values, and adjust for multiple testing (e.g. with the Bonferroni correction).
- Compute standardized mean differences (SMDs).
- Provide a list of alternative labels for variables
- Limit the output of categorical variables to the top N rows.
- Display remarks relating to the appopriateness of summary measures (for example, computing tests for multimodality and normality).
Installation
To install the package with pip, run:
pip install tableone
To install this package with conda, run:
conda install -c conda-forge tableone
Example usage
- Import libraries:
from tableone import TableOne, load_dataset
import pandas as pd
- Load sample data into a pandas dataframe:
data=load_dataset('pn2012')
- Optionally, a list of columns to be included in Table 1:
columns = ['Age', 'SysABP', 'Height', 'Weight', 'ICU', 'death']
- Optionally, a list of columns containing categorical variables:
categorical = ['ICU', 'death']
- Optionally, a list of columns containing continuous variables:
continuous = ['Age', 'SysABP', 'Height', 'Weight']
- Optionally, a categorical variable for stratification, a list of non-normal variables, and a dictionary of alternative labels:
groupby = 'death'
nonnormal = ['Age']
rename={'death': 'mortality'}
- Create an instance of TableOne with the input arguments:
mytable = TableOne(data, columns=columns, categorical=categorical, continuous=continuous, groupby=groupby, nonnormal=nonnormal, rename=rename, pval=False)
- Display the table using the
tabulatemethod. Thetablefmtargument allows the table to be displayed in multiple formats, including "github", "grid", "fancy_grid", "rst", "html", and "latex".
print(mytable.tabulate(tablefmt = "fancy_grid"))
- ...which prints the following table to screen:
Grouped by mortality:
| Missing | 0 | 1 | ||
|---|---|---|---|---|
| n | 864 | 136 | ||
| Age | 0 | 66 [52,78] | 75 [62,83] | |
| SysABP | 291 | 115.36 (38.34) | 107.57 (49.43) | |
| Height | 475 | 170.33 (23.22) | 168.51 (11.31) | |
| Weight | 302 | 83.04 (23.58) | 82.29 (25.40) | |
| ICU | CCU | 0 | 137 (15.86) | 25 (18.38) |
| CSRU | 194 (22.45) | 8 (5.88) | ||
| MICU | 318 (36.81) | 62 (45.59) | ||
| SICU | 215 (24.88) | 41 (30.15) | ||
| mortality | 0 | 0 | 864 (100.0) | |
| 1 | 136 (100.0) |
- Tables can be exported to file in various formats, including LaTeX, CSV, and HTML. Files are exported by calling the
to_formatmethod on the tableone object. For example, mytable can be exported to an Excel spreadsheet named 'mytable.xlsx' with the following command:
mytable.to_excel('mytable.xlsx')
3 maintainers


Metadata
3 maintainers
Release files for tableone 0.9.6
For a detailed explanation of source distributions (sdists) and built distributions (wheels), please see the package formats documentation.
Source distribution (sdist)
| File | Size | Uploaded | |
|---|---|---|---|
| tableone-0.9.6.tar.gz | 774.2 kB | Details |
Built distribution (wheel)
| File | Interpreter | ABI | Platform | Reset |
|---|---|---|---|---|
| tableone-0.9.6-py3-none-any.whl | Python 3 | none | any | Details |
Total release size: 817.8 kB
Release files / tableone-0.9.6.tar.gz
| Download URL | tableone-0.9.6.tar.gz |
|---|---|
| Size | 774.2 kB |
| Tags | Source |
|
SHA-256 checksum How to use checksums |
466e1d7b11d600081f3c84d630ee1155b21755bc5d4c36aa7d20aa301d667abc
|
|
BLAKE2b-256 checksum How to use checksums |
7b7389df5ae4dfe687d92d3b622451f5d71b39a4589c4dda06987b04c2c767a0
|
| Upload date | |
|
Uploaded using Trusted Publishing? What is trusted publishing? |
No |
| Uploaded via |
twine/6.2.0 CPython/3.13.5
|
Release files / tableone-0.9.6-py3-none-any.whl
| Download URL | tableone-0.9.6-py3-none-any.whl |
|---|---|
| Size | 43.6 kB |
| Tags | Python 3 |
|
SHA-256 checksum How to use checksums |
e6b7b0f00d9f3b271b0d6aa38c636a18459994e72c744d7e0821004671760e1b
|
|
BLAKE2b-256 checksum How to use checksums |
4d9a90c5d549de582850aa181e5cf5d0ff15faf77e3cb6a1633204eb2573328d
|
| Upload date | |
|
Uploaded using Trusted Publishing? What is trusted publishing? |
No |
| Uploaded via |
twine/6.2.0 CPython/3.13.5
|














