A sleek tool that displays visually appealing progress bars and draws metric based curves in real-time.

Project description

TCurve
A sleek progress bar tool
For better experience of printing on the terminal.


🚀 Spotlight
📈 Fascinating Dashboard
It shows visually appealing progress bars and draws metric based curves in real-time.
⚡ Quick Start
You can simply take it as a wrapper or help you plot curves.
from tcurve import Dash as tcd
from time import sleep

# a simple wrapper
for i in tcd(range(10)):
    time.sleep(0.5)

# wrap a generator
for i in tcd(enumerate(range(30))):
    time.sleep(0.3)

# with keyword arguments
for i,n in tcd(enumerate(range(30)), format={'number': [lambda x:x[1], CUSTOM]}, epoch=2, mpe=30, stage='COUNT', interv=1, wipe=False):
    time.sleep(0.3)

# in a complicated manner
dash = tcd(format={'Acc': ['.1f', PERCENT]})
unit_acc = [0.012, 0.045, 0.134, 0.189, 0.234, 0.278, 0.345, 0.378, 0.456, 0.423, 0.51, 0.599, 0.623, 0.62, 0.7] # create a fake array for this tutorial
fake_acc = unit_acc + unit_acc[::-1] + unit_acc + unit_acc[::-1] + unit_acc + unit_acc[::-1]
for i, a in enumerate(fake_acc):
    time.sleep(0.1)
    dash({'Accuracy': a}, 0, i, len(fake_acc))
🔥 Dive Deeper
Let's take the last example in previous part to show how could you use more arguments for delicate control.
# below is the common setting
unit_acc = [0.012, 0.045, 0.134, 0.189, 0.234, 0.278, 0.345, 0.378, 0.456, 0.423, 0.51, 0.599, 0.623, 0.62, 0.7] # create a fake array for this tutorial
flat_acc = [0.5, 0.5, 0.5, 0.5, 0.5, 0.5, 0.5, 0.5, 0.5, 0.5]
fake_acc = 10 * (unit_acc + unit_acc[::-1] + flat_acc)
We only take this for-loop to demonstrate. First, you can use is_global=True to plot the entire curve.
dash = tcd(format={'Acc': ['.1f', PERCENT]})
for i, a in enumerate(fake_acc):
    time.sleep(0.1)
    dash({'Accuracy': a}, 0, i, len(fake_acc), is_global=True)
Make is_elastic=True to dynamically stretch or squeeze the vertical axis.
dash = tcd(format={'Acc': ['.1f', PERCENT]})
for i, a in enumerate(fake_acc):
    time.sleep(0.1)
    dash({'Accuracy': a}, 0, i, len(fake_acc), is_global=False)
Make is_elastic=True to dynamically stretch or squeeze the vertical axis so that the fluctuation of curves is prominent enough to be observed.
dash = tcd(format={'Acc': ['.1f', PERCENT]})
for i, a in enumerate(fake_acc):
    time.sleep(0.1)
    dash({'Accuracy': a}, 0, i, len(fake_acc), is_elastic=True)
When you have several variables, set in_loop and last_for to switch among them.
e.g in_loop=(0, 1), last_for=5 means dashboard is going to show curves of var[0] and var[1] in turns. The displayed curve changes every 5 steps.
dash = tcd(format={'Acc': ['.1f', PERCENT], 'Level': ['.d', RAW]})
for i, a in enumerate(fake_acc):
    time.sleep(0.1)
    dash({'Accuracy': a, 'Level': i*i}, 0, i, len(fake_acc), in_loop=(0, 1), last_for=5)
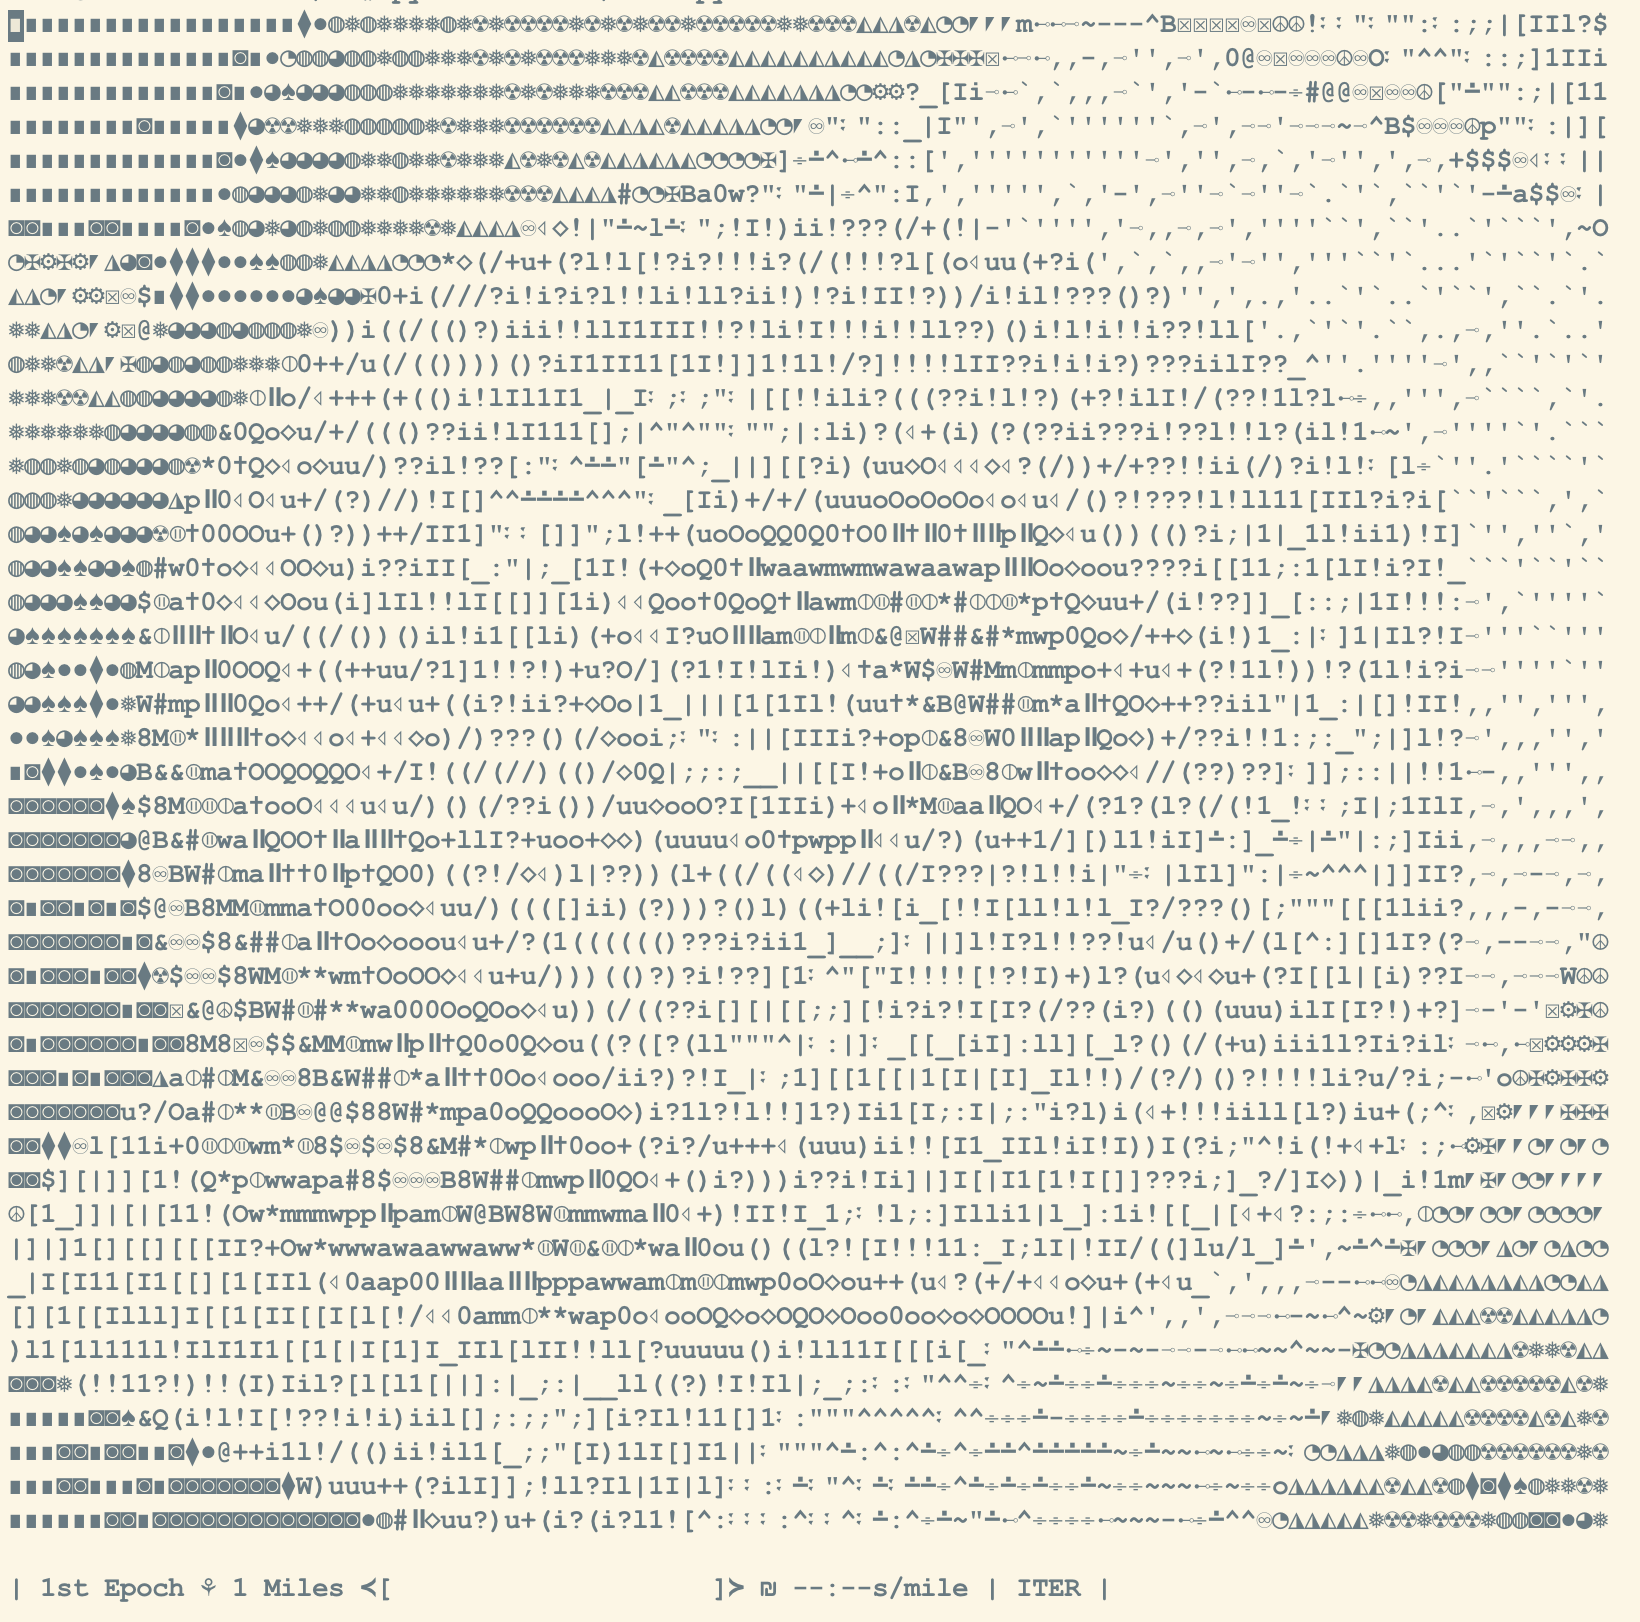
What's more, you can even draw the gray image on the terminal.
dash = Dash(format={'I': [lambda *x:1, IMAGE]})
for i, img in enumerate(images):
    time.sleep(0.1)
    # read images here
    dash({'I': img}, 0, i, len(images))
Try to squint at the right side. :D

📦 Installation
Install tcurve via pip
pip install tcurve
Install the following libs to access full functions.
- numpy
- pandas
- matplotlib
- seaborn
❤️ Support
If you find TCurve helpful, please give it a ⭐ on GitHub! ▶️ https://github.com/SeriaQ/TCurve
Release history Release notifications | RSS feed


Download files
Download the file for your platform. If you're not sure which to choose, learn more about installing packages.
Source Distribution
Built Distribution
Filter files by name, interpreter, ABI, and platform.
If you're not sure about the file name format, learn more about wheel file names.
Copy a direct link to the current filters
File details
Details for the file tcurve-0.0.3.tar.gz.
File metadata
- Download URL: tcurve-0.0.3.tar.gz
- Upload date:
- Size: 14.1 kB
- Tags: Source
- Uploaded using Trusted Publishing? No
- Uploaded via: twine/6.1.0 CPython/3.10.12
File hashes
| Algorithm | Hash digest | |
|---|---|---|
| SHA256 |
7dd4533ae54276718d35aacc44467cc38f4e4d38089a00003be663c2d259b28a
|
|
| MD5 |
64ec67e4582d7a527c84341ae0c0e67c
|
|
| BLAKE2b-256 |
722644ff1eb9c93cd3c01243a99208f7af579ecf1051ba51b8d705415ca8726e
|
File details
Details for the file tcurve-0.0.3-py3-none-any.whl.
File metadata
- Download URL: tcurve-0.0.3-py3-none-any.whl
- Upload date:
- Size: 13.5 kB
- Tags: Python 3
- Uploaded using Trusted Publishing? No
- Uploaded via: twine/6.1.0 CPython/3.10.12
File hashes
| Algorithm | Hash digest | |
|---|---|---|
| SHA256 |
6f6efb337cd9ac7b780acfa378726bf10c7f4bdf3f3aae368dc8899ee7cee51e
|
|
| MD5 |
09247a918a3412ebbd00e7920ac40f6f
|
|
| BLAKE2b-256 |
a4fbc89ce23e1c8185450a92b04d1e751f17ea41a68589ffc8cd03dce7ce8b73
|


