ToolAtlas — Discover, Govern, and Optimize MCP Tools

Project description
ToolAtlas
The Knowledge Layer for MCP Tools


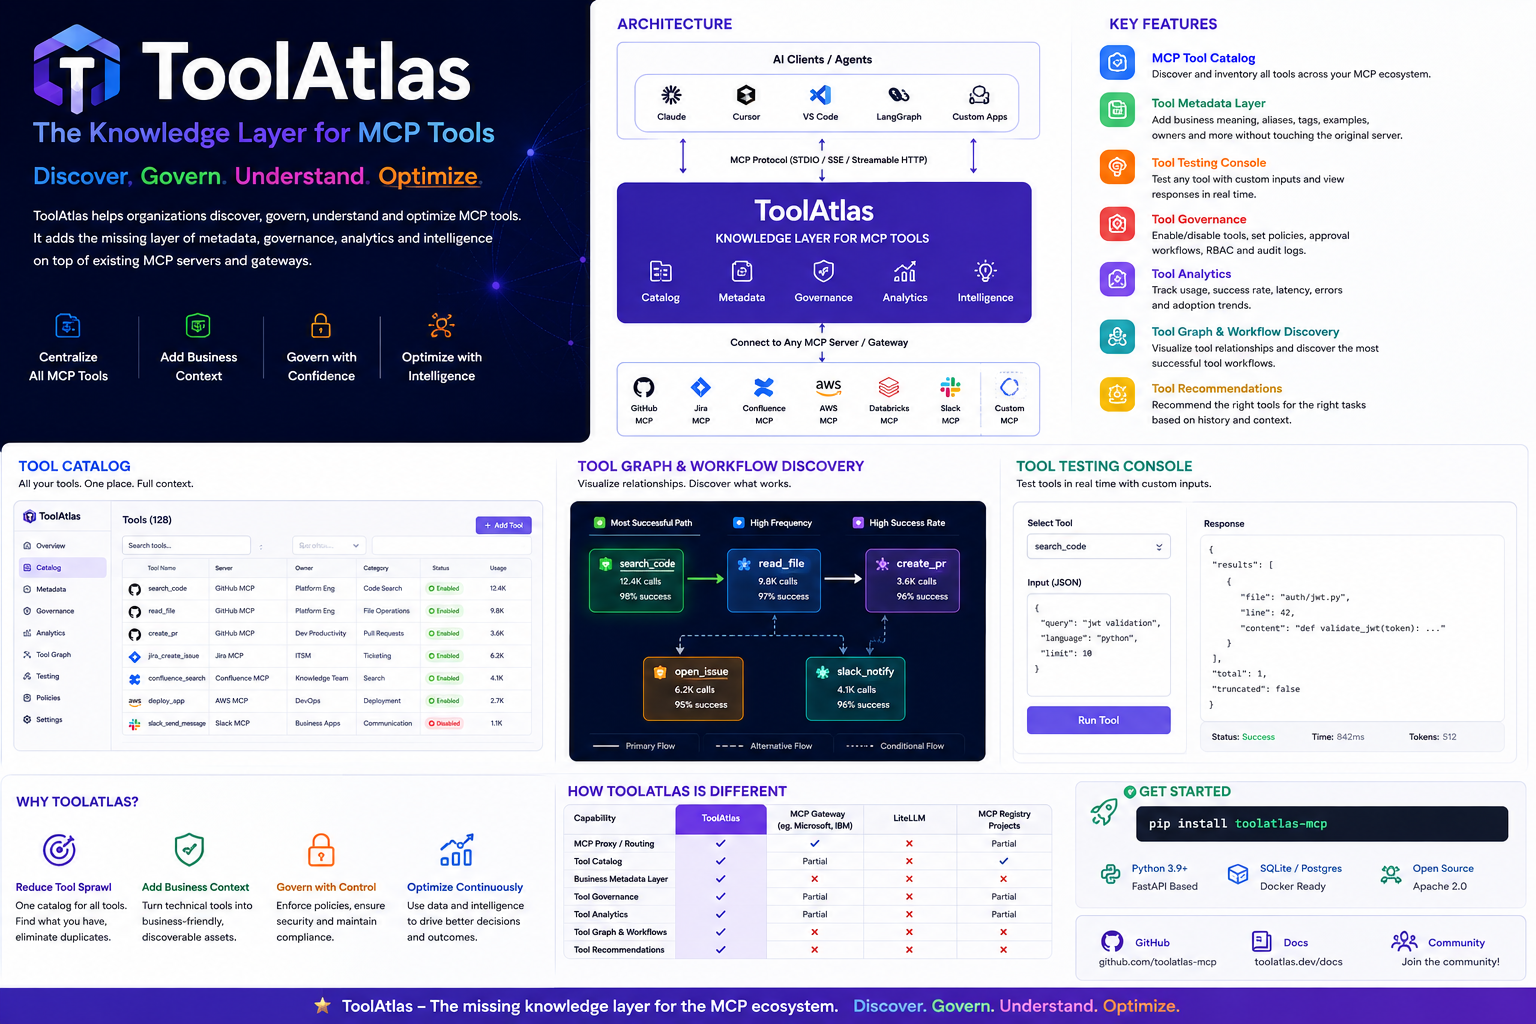
ToolAtlas helps organizations discover, govern, understand, and optimize MCP tools without modifying existing MCP servers.
pip install toolatlas-mcp
toolatlas start                  # defaults: port 8081, json storage
toolatlas start --port 9000 --storage sqlite --data-dir ./data
Why ToolAtlas?
As MCP adoption grows, teams quickly accumulate hundreds of tools across GitHub, Jira, Confluence, AWS, Databricks, Slack, internal systems, and custom MCP servers. The challenge is no longer connecting tools — it's understanding them.
| Problem | How ToolAtlas Solves It |
|---|---|
| Tool Sprawl | Central catalog of every MCP tool — see what exists, what's used, what's duplicated, what's dangerous |
| Lack of Business Context | Add business descriptions, aliases, tags, domain categories, and glossary definitions — without modifying the original server |
| Governance | Per-proxy enable/disable, tool selection on server link, audit logging via call traces |
| Tool Intelligence | Usage analytics, success rates, latency tracking, top tools by usage |
ToolAtlas sits between AI clients and MCP servers — it's the control plane for your MCP ecosystem.
"LiteLLM manages models. ToolAtlas manages tools. "
Key Features
📋 MCP Tool Catalog
Central inventory of all MCP tools across all your servers — searchable, filterable, sortable from the web dashboard.
🗂️ Proxy Groups — Organize Tools by Team or Purpose
Create proxies (named groups) and assign MCP servers to each. Every proxy exposes a different toolset.
Proxy "dev"    → GitHub + GitLab     (for developers)
Proxy "pm"     → Jira + Confluence   (for project managers)
Proxy "devops" → AWS + PagerDuty     (for operations)
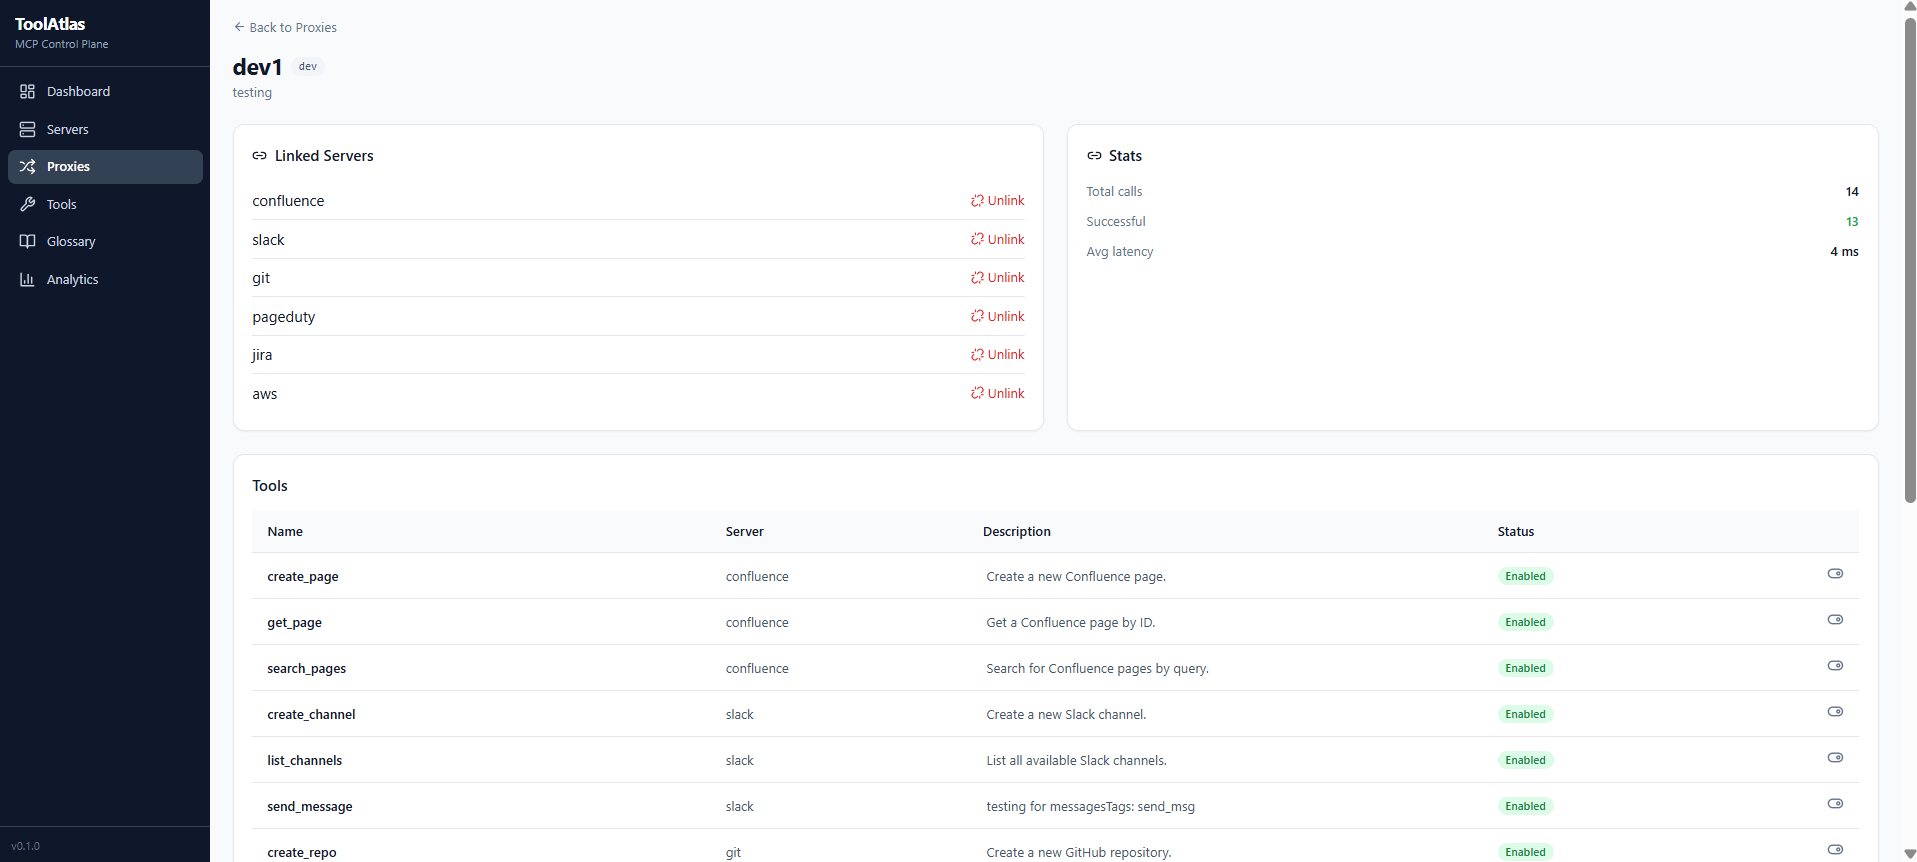
🛡️ Per-Tool Governance — Control What Each Proxy Exposes
Every tool can be independently configured per proxy:
| Control | What it does |
|---|---|
| Enable / Disable | Block dangerous tools (e.g. delete_repo) without touching the server |
| Custom Description | Rewrite the tool's description so AI agents understand it in context |
| Alias | Rename the tool per proxy |
| Tool Selection on Link | Pick exactly which tools to expose when linking a server — unselected tools auto-disable |
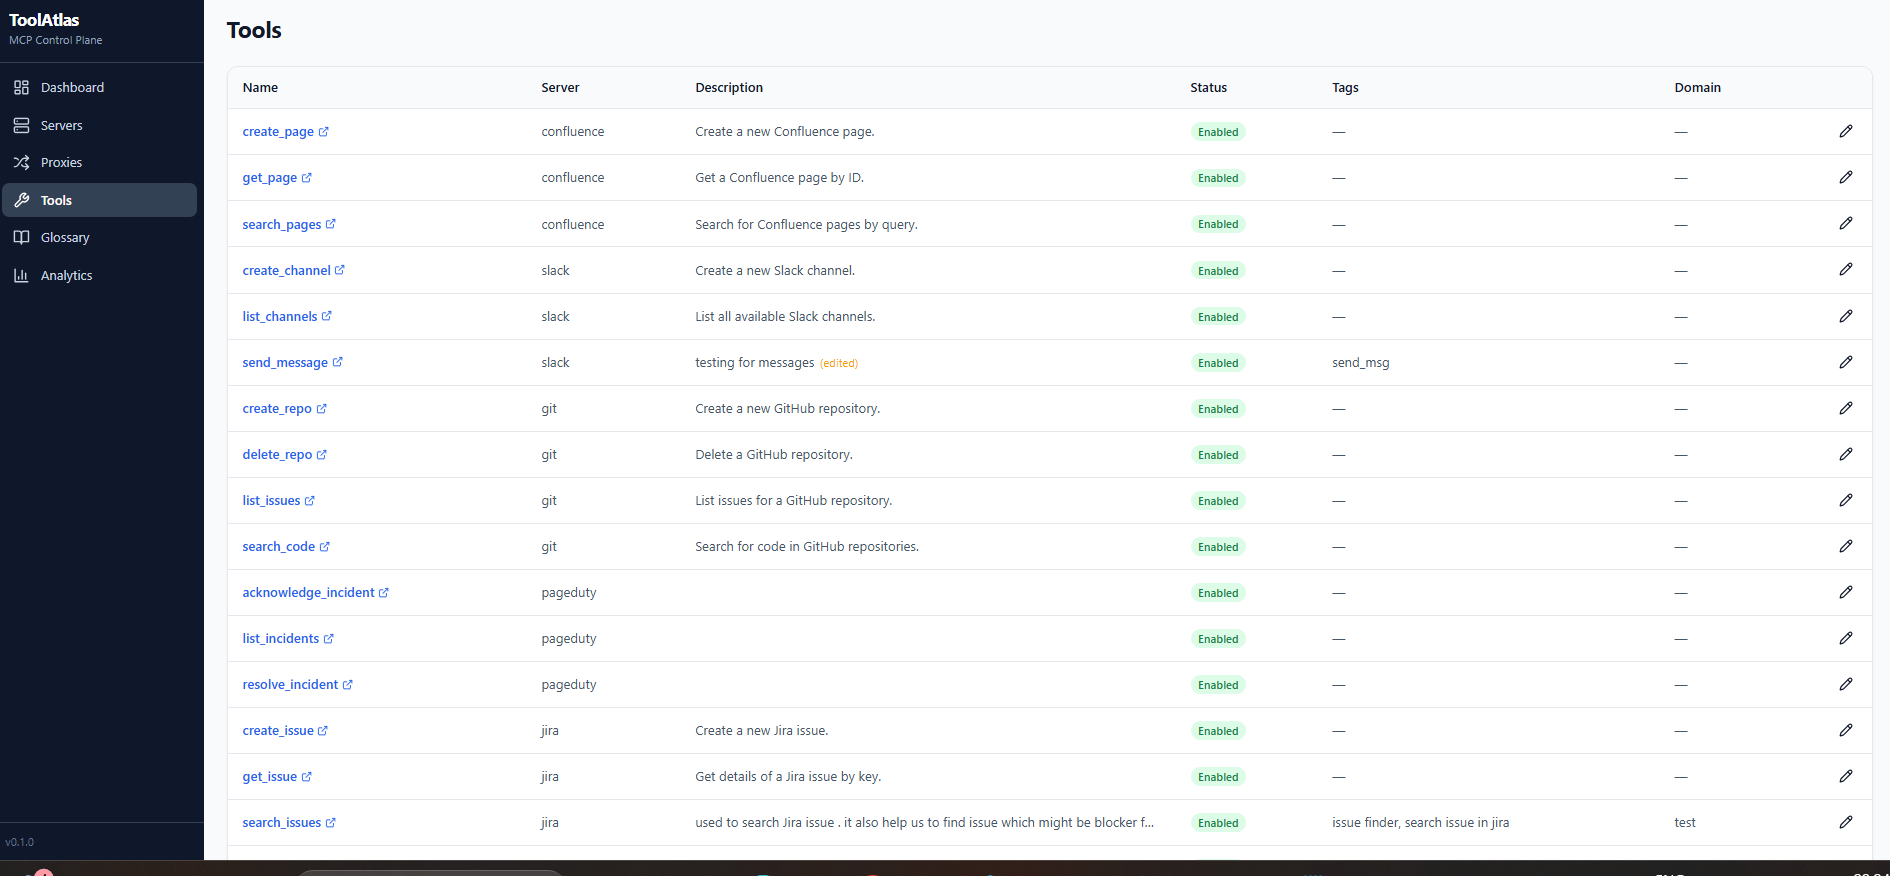
🏷️ Tool Enrichment — Make Tools Smarter
Every registry tool can be enriched with business context. The enriched description is what clients see when they call list_tools:
| Enrichment | Purpose | Example in client view |
|---|---|---|
| Custom Description | Override the original server description | Search for code in GitHub |
| Tags | Add searchable labels | Tags: git, code, search |
| Domain | Categorize by business area | Domain: development |
| Glossary Terms | Link one or more business concepts with definitions | Glossary: Search across all code repositories |
Client sees the full enriched description automatically:
{
  "name": "search_code",
  "description": "Search code in GitHub repositories\nTags: git, code\nDomain: development\nGlossary: Search code across all repositories",
  "inputSchema": { ... }
}
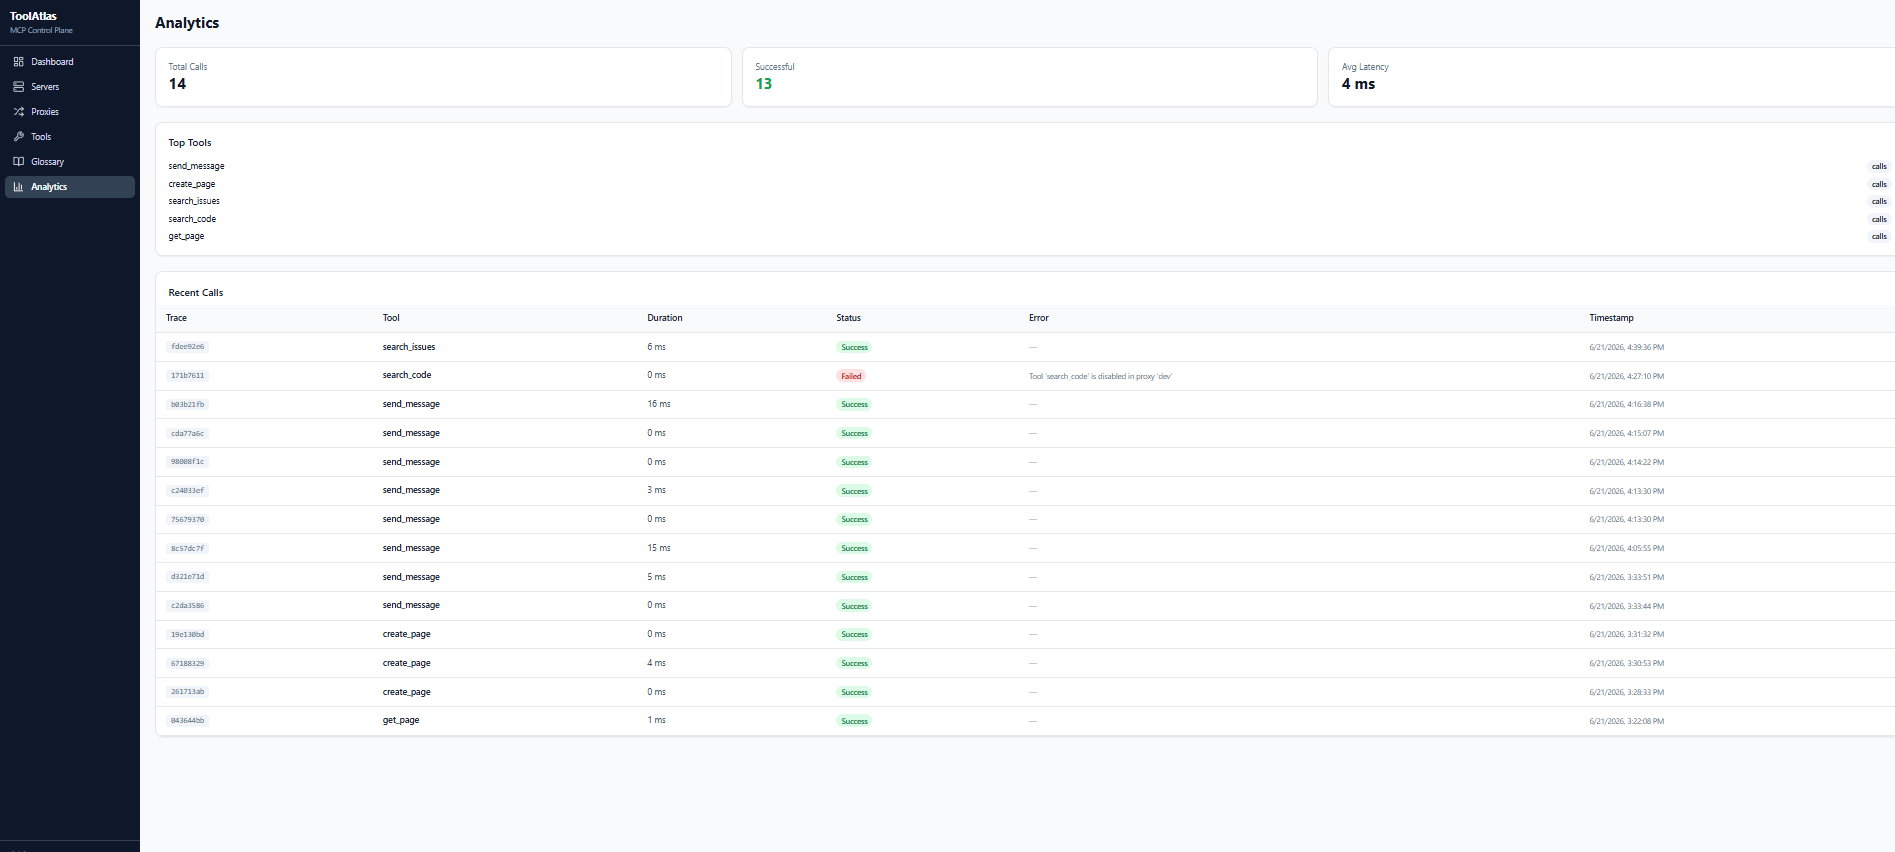
📊 Usage Analytics
Every tool call is tracked — duration, success/failure, arguments. Dashboard shows top tools, latency trends, error rates, and per-call trace timelines.
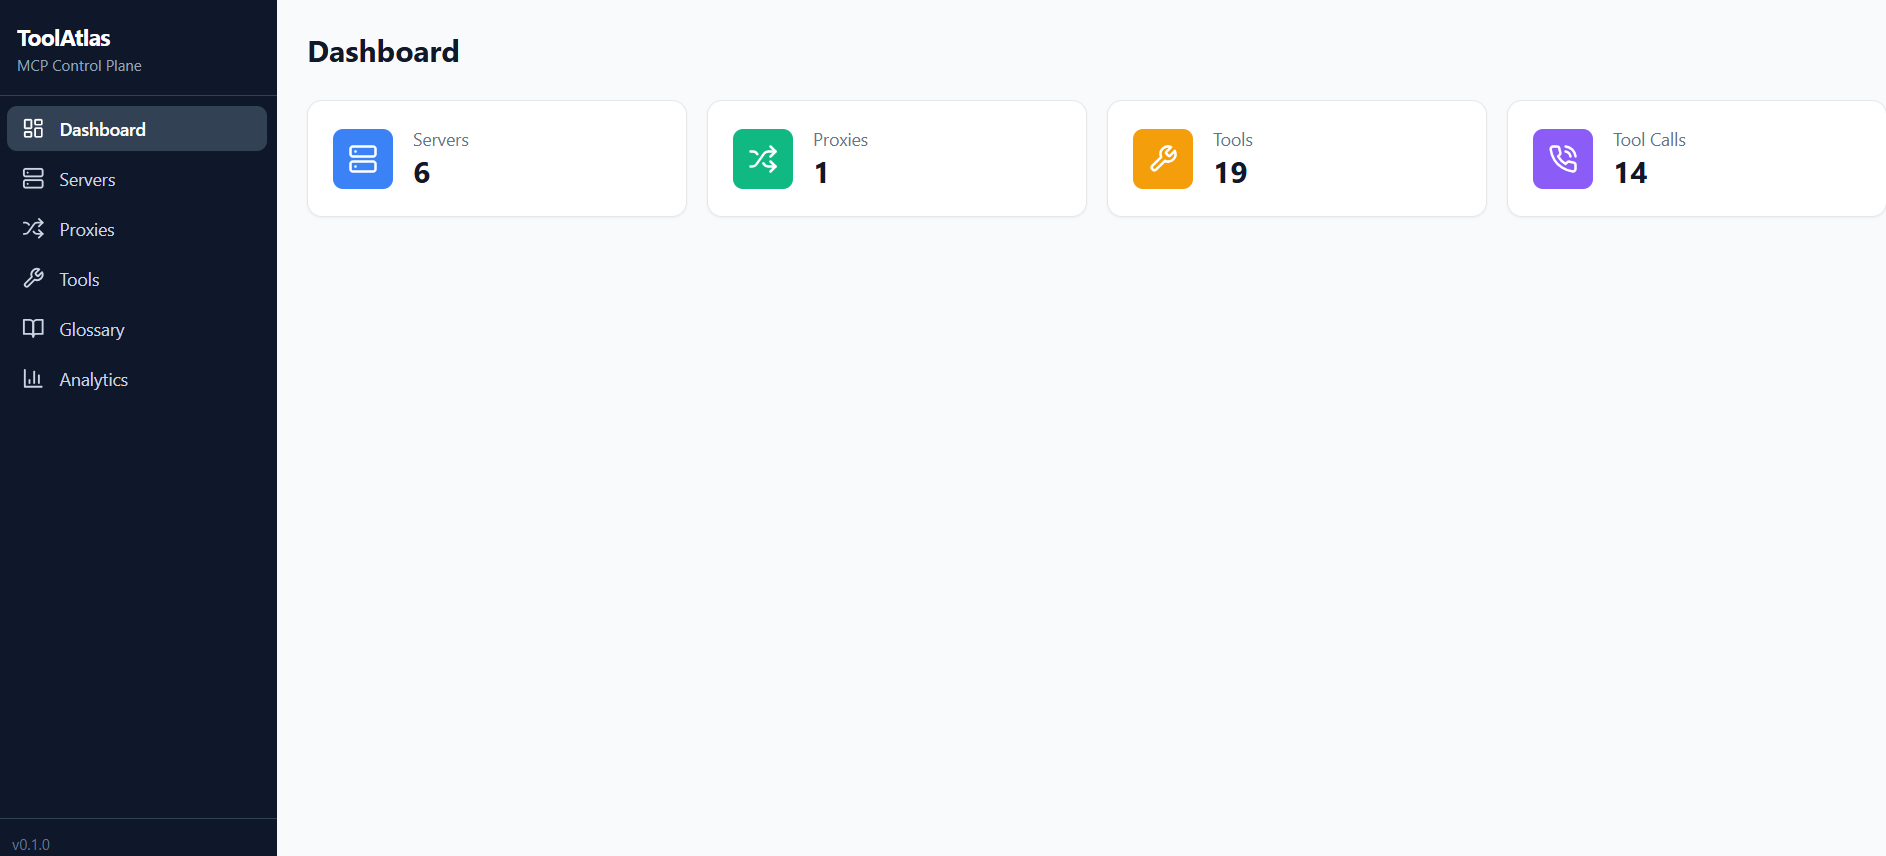
🌐 Web Dashboard
Full SPA for managing everything visually — servers, proxies, tool settings, glossary, analytics.
🧪 Tool Testing Console
Test any tool directly from the UI — pass arguments via a dynamic form (auto-generated from the tool's input schema) and see the result in real time with duration tracking.
📂 Glossary with Domain Hierarchy
Organize glossary terms under domains (created first, then terms under them). Terms are grouped by domain in the UI. Assign multiple glossary terms to a single tool. Edit/delete domains and terms inline. Bulk import entire glossaries via JSON/CSV file upload with automatic domain creation.
🔍 Filters & Search
Every management page (Tools, Servers, Proxies, Glossary, Analytics) includes search bars and filter dropdowns for quick navigation.
🔮 Planned Features
| Feature | Status |
|---|---|
| Tool Graph — Visualize relationships between tools and discover real execution workflows | Planned |
| Tool Recommendations — Recommend the best tools for tasks based on usage patterns | Planned |
Architecture
┌─────────────────┐     ┌─────────────────────────────────────┐     ┌─────────────────┐
│  MCP Clients    │     │         ToolAtlas                    │     │  MCP Servers     │
│                 │     │                                     │     │                  │
│  Claude         │────▶│  Proxy "dev"     ── governance ──▶ │────▶│  GitHub MCP      │
│  Cursor         │────▶│  Proxy "pm"      ── governance ──▶ │────▶│  Jira MCP        │
│  Custom Agents  │────▶│  Proxy "devops"  ── governance ──▶ │────▶│  Slack MCP       │
│                 │     │                                     │     │  Confluence MCP  │
│                 │     │  ┌──────────────┐  ┌─────────────┐ │     │  AWS MCP         │
│                 │     │  │ Registry     │  │ Analytics   │ │     │  Custom MCP      │
│                 │     │  │ DB + API     │  │ Tracker     │ │     └─────────────────┘
│                 │     │  └──────────────┘  └─────────────┘ │
│                 │     │  ┌──────────────────────────────┐  │
│                 │     │  │  Web Dashboard (React SPA)   │  │
│                 │     │  └──────────────────────────────┘  │
│                 │     │  ┌──────────────────────────────┐  │
│                 │     │  │  CLI: toolatlas start/add    │  │
│                 │     │  └──────────────────────────────┘  │
│                 │     └─────────────────────────────────────┘
Clients speak MCP to ToolAtlas. ToolAtlas enforces governance, enriches tool descriptions, logs every call, and forwards to real MCP servers.
Installation
Prerequisites
- Python 3.10+ (download)
- pip (comes with Python)
Install from PyPI (recommended)
pip install toolatlas-mcp
Verify it installed:
toolatlas --help
You should see the CLI help with start, server, proxy commands.
Install from source
git clone https://github.com/anomalyco/toolatlas-mcp
cd toolatlas-mcp

# Python package
pip install -e ".[dev]"

# Build the web UI
cd ui
npm install
npm run build
cd ..
Usage — Step by Step
1. Start the Server
toolatlas start
Output:
ToolAtlas starting on 127.0.0.1:8081
  Web UI: http://127.0.0.1:8081
  API:    http://127.0.0.1:8081/api/health
Open http://localhost:8081 in your browser to see the dashboard.
2. Add an MCP Server
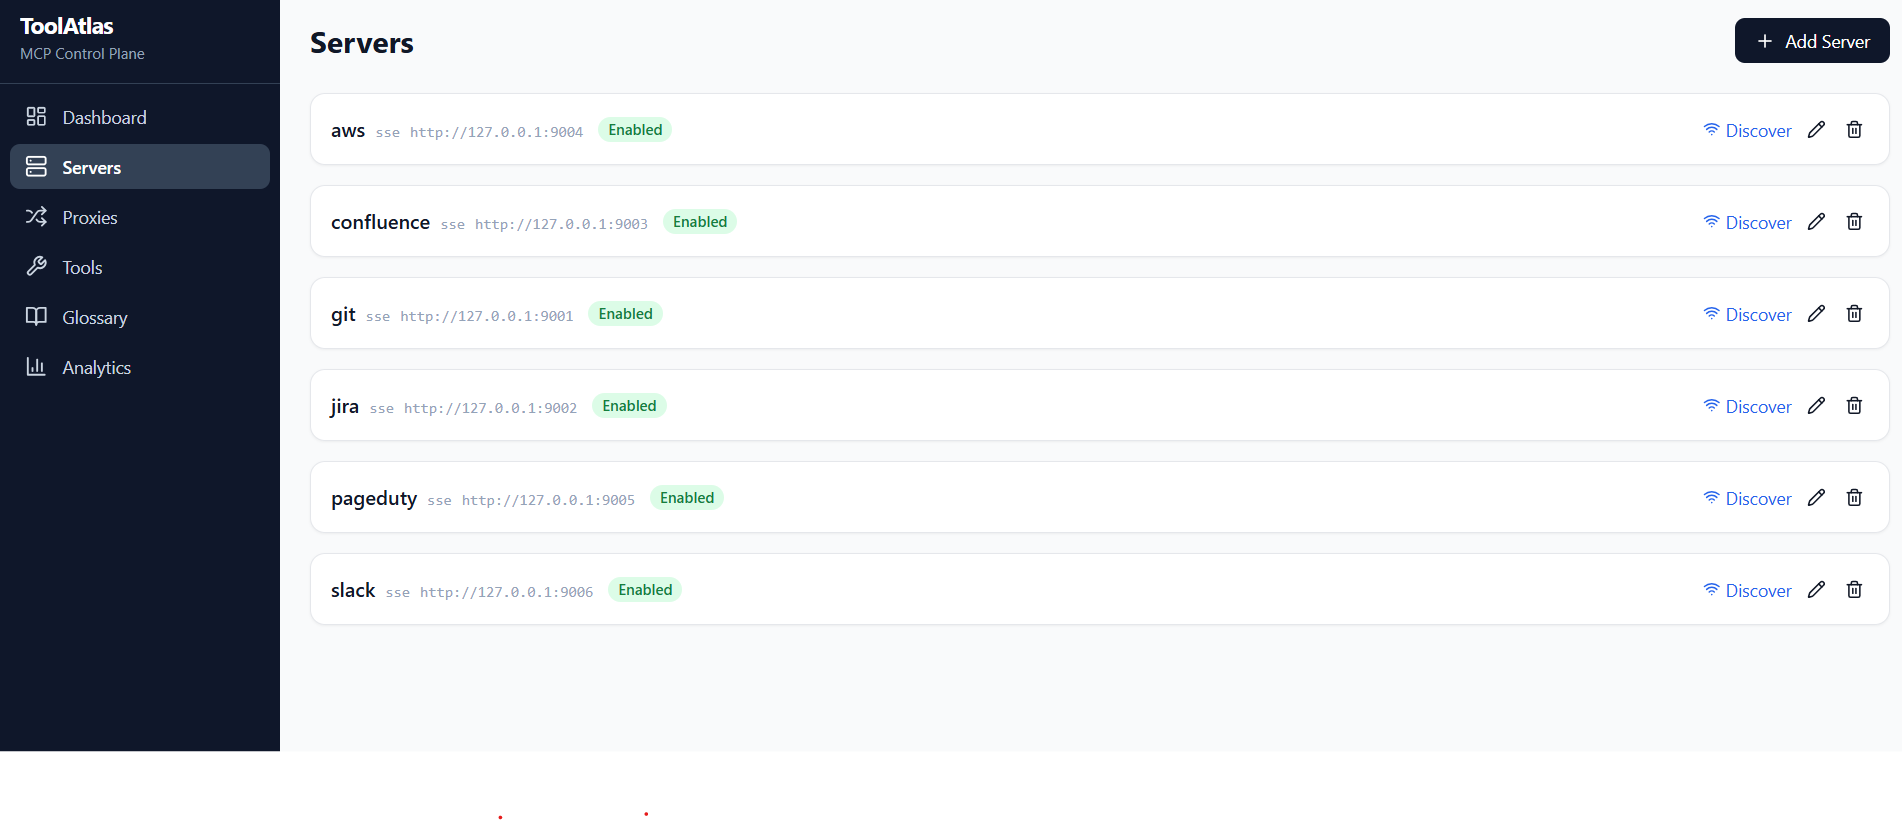
You can add servers via CLI or the web UI.
CLI — stdio server (e.g., npx-based):
toolatlas server add github \
  --transport stdio \
  --command "npx" \
  --args "-y" "@modelcontextprotocol/server-github"
CLI — SSE server (already running):
toolatlas server add my-api \
  --transport sse \
  --url "http://localhost:9001/sse"
Web UI: Go to Servers → Add Server, fill in the details.
3. Discover Tools
After adding a server, discover its tools:
# Via CLI (uses the API):
curl -X POST http://localhost:8080/api/servers/{server_id}/discover
Or click Discover & Save New on the Server detail page in the web UI.
4. Create a Proxy
Proxies organize tools into groups. Each proxy exposes a subset of your servers' tools.
# Create a proxy
toolatlas proxy add dev --description "Developer tools"

# Link servers to it
toolatlas proxy link dev github
toolatlas proxy link dev gitlab
List your proxies:
toolatlas proxy list
Tip: In the web UI, when linking a server you can select exactly which tools to expose — unselected tools are automatically disabled for that proxy. No need to manually toggle them afterwards.
5. Configure Tools Per Proxy
In the web UI, go to a Proxy detail page → Tools tab. For each tool:
- Toggle enabled/disabled — disable
delete_repofor the "dev" proxy - Set a custom description — e.g., "Search code in GitHub repos"
- Alias the tool — rename it for clarity
You can also select which tools to include at link time — click Link next to a server to open the tool picker modal.
6. Enrich Tool Metadata
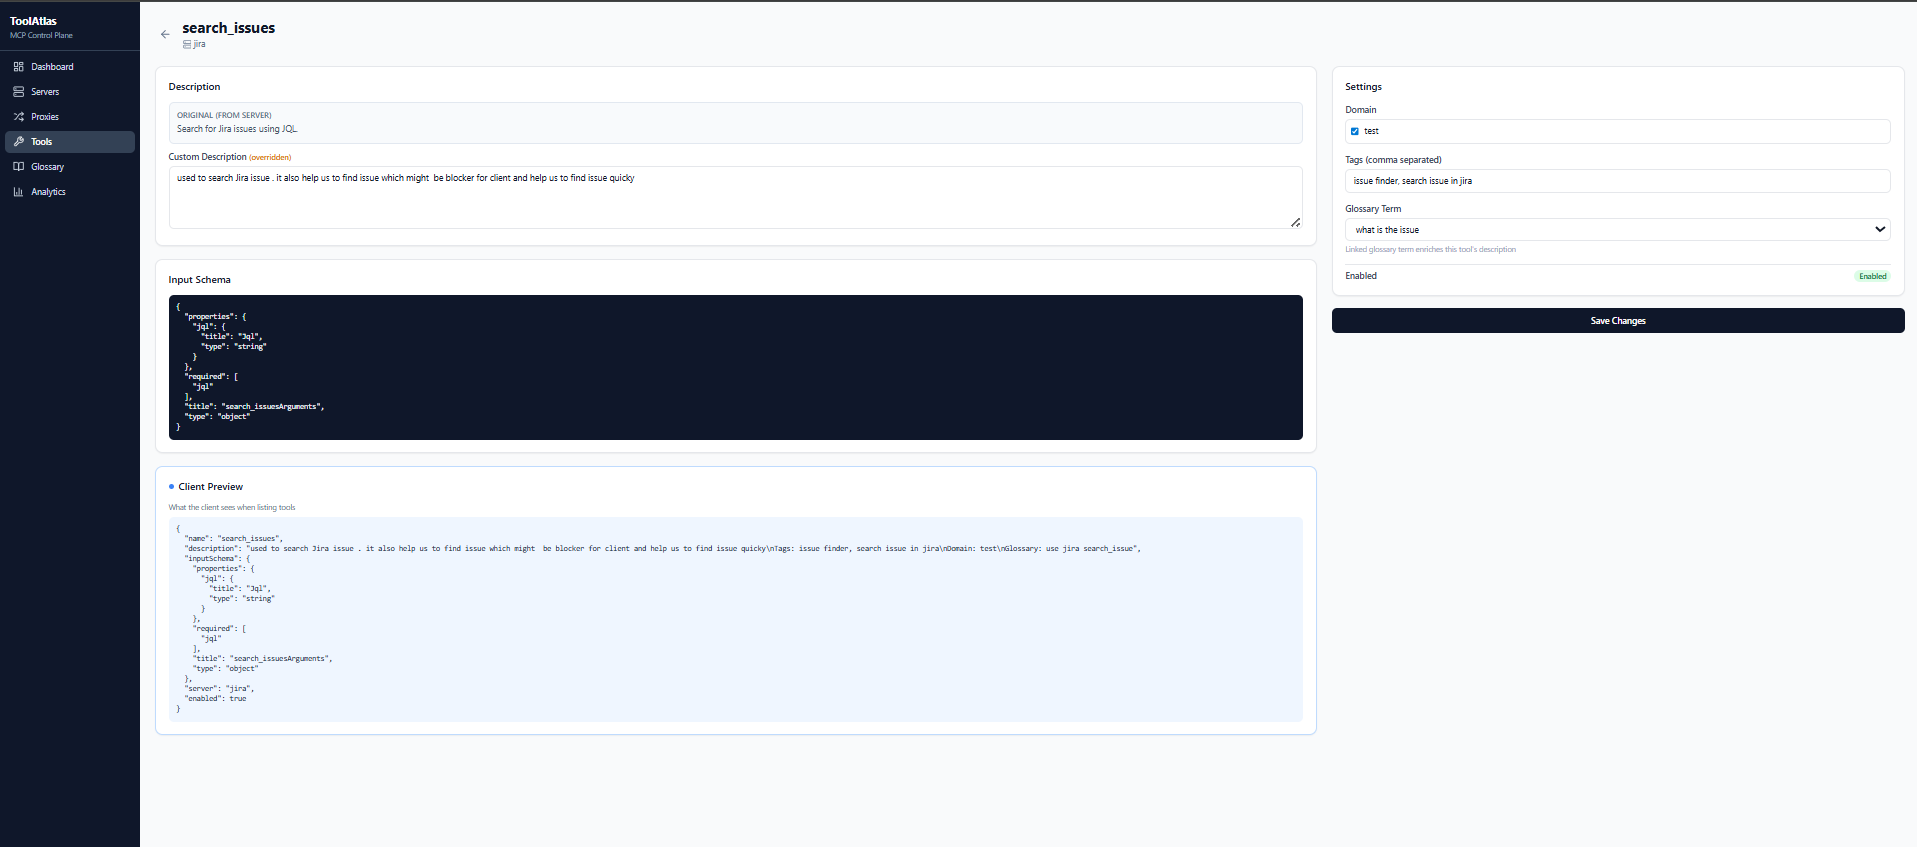
In the Tool detail page, you can add:
- Tags — comma-separated labels like
git, code, search - Domain — categorize the tool (e.g., "development", "security")
- Glossary Terms — link one or more business terms with definitions (multi-select, grouped by domain)
First create glossary domains and terms under the Glossary page, then assign them to tools from the tool detail page.
7. Connect Your AI Client
Configure your MCP client (Claude Desktop, Cursor, custom agent) to point to ToolAtlas. Replace dev with your proxy's slug name.
Claude Desktop (claude_desktop_config.json):
{
  "mcpServers": {
    "dev": {
      "type": "sse",
      "url": "http://localhost:8081/proxy/dev/sse"
    }
  }
}
Cursor / VS Code / any MCP client — same format; just register an SSE server with the URL above.
The proxy slug (dev, prod, etc.) is the name you gave when creating the proxy. Each proxy exposes a different toolset.
Advanced: Raw JSON-RPC (without SSE)
For scripting or testing without an MCP client library, use the message endpoint directly. Each call needs its own session_id (UUID).
import httpx, uuid

session_id = str(uuid.uuid4())
proxy_url = f"http://localhost:8081/proxy/dev/message/{session_id}"

# Initialize
httpx.post(proxy_url, json={
    "jsonrpc": "2.0", "id": 1, "method": "initialize",
    "params": {"protocolVersion": "2024-11-05", "capabilities": {}, "clientInfo": {"name": "test", "version": "1.0"}}
}).json()

# Notify initialized
httpx.post(proxy_url, json={
    "jsonrpc": "2.0", "method": "notifications/initialized"
}).json()

# List tools
httpx.post(proxy_url, json={
    "jsonrpc": "2.0", "id": 2, "method": "list_tools"
}).json()

# Call a tool
httpx.post(proxy_url, json={
    "jsonrpc": "2.0", "id": 3, "method": "call_tool",
    "params": {"name": "search_code", "arguments": {"query": "auth"}}
}).json()
8. View Analytics
Go to the Analytics page in the web UI to see:
- Total calls, success rate, average latency
- Top tools by usage
- Individual call traces with event timelines (proxy resolution → server call → response)
CLI Reference
| Command | Description |
|---|---|
toolatlas start |
Start the ToolAtlas server (defaults: port 8081, json storage) |
toolatlas start --port 9000 --host 0.0.0.0 |
Start on a different address |
toolatlas start --storage sqlite |
Use SQLite storage backend |
toolatlas start --data-dir ./my-data |
Custom data directory |
toolatlas start --reload |
Start with auto-reload (development) |
All flags: --port, --host, --storage (json/sqlite), --data-dir, --reload. Environment variables are still supported with TOOLATLAS_ prefix and take precedence over defaults.
Storage
ToolAtlas supports two storage backends:
| Backend | Type | Best for |
|---|---|---|
| JSON File (default) | json |
Development, single-user, portable setups, git-versioned data |
| SQLite | sqlite |
Production, multi-user, analytics-heavy workloads |
The data.json file is saved to the same data directory as the SQLite database.
Configuration
Set via environment variables with TOOLATLAS_ prefix:
| Variable | Default | Description |
|---|---|---|
TOOLATLAS_HOST |
127.0.0.1 |
Bind address |
TOOLATLAS_PORT |
8081 |
HTTP port (auto-increments if in use) |
TOOLATLAS_DATABASE_URL |
sqlite+aiosqlite:///<data_dir>/toolatlas.db |
Database connection (only for sqlite backend) |
TOOLATLAS_STORAGE_TYPE |
json |
Storage backend (json or sqlite) |
TOOLATLAS_DATA_DIR |
~/.toolatlas (Unix) / %APPDATA%\ToolAtlas (Win) |
Data directory for databases and config |
TOOLATLAS_LOG_LEVEL |
INFO |
Log level (DEBUG, INFO, WARNING, ERROR) |
TOOLATLAS_BASE_PATH |
"" |
URL prefix when deployed behind a reverse proxy (e.g. /toolatlas) |
When starting interactively, you'll be prompted for the data directory and storage type if the environment variables aren't set. The CLI automatically scans for a free port (8080→8280) if the default port is occupied.
Example:
export TOOLATLAS_HOST=0.0.0.0
export TOOLATLAS_PORT=9000
export TOOLATLAS_STORAGE_TYPE=json
export TOOLATLAS_DATA_DIR=./toolatlas-dev
toolatlas start
To use non-interactive mode (no prompts):
TOOLATLAS_DATA_DIR=/custom/path TOOLATLAS_STORAGE_TYPE=json toolatlas start
Subpath Deployment
To deploy ToolAtlas under a URL prefix (e.g. https://xyz.com/toolatlas/) behind a reverse proxy like Nginx:
-
Set the base path:
export TOOLATLAS_BASE_PATH=/toolatlas
-
Rebuild the React UI with the subpath:
cd ui
VITE_BASE_URL=/toolatlas/ VITE_BASE_PATH=/toolatlas npm run build
-
Configure Nginx to strip the
/toolatlasprefix and proxy to ToolAtlas:location /toolatlas/ { proxy_pass http://127.0.0.1:8081/; proxy_http_version 1.1; proxy_set_header Upgrade $http_upgrade; proxy_set_header Connection "upgrade"; proxy_buffering off; proxy_read_timeout 86400s; }
The trailing slash in proxy_pass strips /toolatlas before forwarding, so ToolAtlas receives requests at /api/..., /proxy/... as usual. The base_path setting only affects URL generation (SSE message_url, OpenAPI docs).
- MCP clients connect to the full path:
{ "url": "https://xyz.com/toolatlas/proxy/dev/sse" }
See docs/deploy-under-subpath.md for full details.
Client Examples
Python
import httpx, uuid

session_id = str(uuid.uuid4())
base = f"http://localhost:8081/proxy/dev/message/{session_id}"

# Initialize (required before any other call)
httpx.post(base, json={
    "jsonrpc": "2.0", "id": 1, "method": "initialize",
    "params": {"protocolVersion": "2024-11-05", "capabilities": {}, "clientInfo": {"name": "test", "version": "1.0"}}
}).json()

httpx.post(base, json={"jsonrpc": "2.0", "method": "notifications/initialized"}).json()

# List available tools
tools = httpx.post(base, json={
    "jsonrpc": "2.0", "id": 2, "method": "list_tools"
}).json()
print(tools)

# Call a tool
result = httpx.post(base, json={
    "jsonrpc": "2.0", "id": 3, "method": "call_tool",
    "params": {"name": "search_code", "arguments": {"query": "auth"}}
}).json()
print(result)
curl
SESSION_ID=$(uuidgen)

# Initialize
curl -s -X POST "http://localhost:8081/proxy/dev/message/$SESSION_ID" \
  -H "Content-Type: application/json" \
  -d '{"jsonrpc":"2.0","id":1,"method":"initialize","params":{"protocolVersion":"2024-11-05","capabilities":{},"clientInfo":{"name":"test","version":"1.0"}}}'

curl -s -X POST "http://localhost:8081/proxy/dev/message/$SESSION_ID" \
  -H "Content-Type: application/json" \
  -d '{"jsonrpc":"2.0","method":"notifications/initialized"}'

# List tools
curl -s -X POST "http://localhost:8081/proxy/dev/message/$SESSION_ID" \
  -H "Content-Type: application/json" \
  -d '{"jsonrpc":"2.0","id":2,"method":"list_tools"}'

# Call a tool
curl -s -X POST "http://localhost:8081/proxy/dev/message/$SESSION_ID" \
  -H "Content-Type: application/json" \
  -d '{"jsonrpc":"2.0","id":3,"method":"call_tool","params":{"name":"search_code","arguments":{"query":"auth"}}}'
Development
git clone https://github.com/anomalyco/toolatlas-mcp
cd toolatlas-mcp

# Python
pip install -e ".[dev]"

# UI
cd ui && npm install && npm run build && cd ..

# Tests
pytest

# Dev server (API only, UI served by Vite on port 5173)
toolatlas start --reload
# In another terminal:
cd ui && npm run dev
License
MIT © ToolAtlas contributors
Release history Release notifications | RSS feed


Download files
Download the file for your platform. If you're not sure which to choose, learn more about installing packages.
Source Distribution
Built Distribution
Filter files by name, interpreter, ABI, and platform.
If you're not sure about the file name format, learn more about wheel file names.
Copy a direct link to the current filters
File details
Details for the file toolatlas_mcp-1.0.2.tar.gz.
File metadata
- Download URL: toolatlas_mcp-1.0.2.tar.gz
- Upload date:
- Size: 2.1 MB
- Tags: Source
- Uploaded using Trusted Publishing? No
- Uploaded via: twine/6.2.0 CPython/3.11.3
File hashes
| Algorithm | Hash digest | |
|---|---|---|
| SHA256 |
20b2813b6e0735de9b8b8078c43f7a02e28743304517561c28e7c13ae7b76f65
|
|
| MD5 |
96afedc022d470841f2ed49a1b342702
|
|
| BLAKE2b-256 |
a1584dc5bf975a192e0d8953d1f3a25907ac4e9165a2bc4deac676f8d02cd1c6
|
File details
Details for the file toolatlas_mcp-1.0.2-py3-none-any.whl.
File metadata
- Download URL: toolatlas_mcp-1.0.2-py3-none-any.whl
- Upload date:
- Size: 128.9 kB
- Tags: Python 3
- Uploaded using Trusted Publishing? No
- Uploaded via: twine/6.2.0 CPython/3.11.3
File hashes
| Algorithm | Hash digest | |
|---|---|---|
| SHA256 |
6c18dac1e12ce4b02b9a4672d541d7f84615f46987fce01ef5a5c21dc26b00b0
|
|
| MD5 |
23c086ea636021e8ffc43415fe0b217b
|
|
| BLAKE2b-256 |
0303ca47fed0f7ac2f6983fcde23e009743c6c9f5eba645e0e568253fe76bcf0
|


