Package for automated signal segmentation, trend classification and analysis.

Project description
Trend classifier


Library for automated signal segmentation, trend classification and analysis.
Installation
-
The package is pip-installable. To install it, run:
pip3 install trend-classifier
Usage
Pandas DataFrame Input
usage:
import yfinance as yf
from trend_classifier import Segmenter

# download data from yahoo finance
df = yf.download("AAPL", start="2018-09-15", end="2022-09-05", interval="1d", progress=False)

x_in = list(range(0, len(df.index.tolist()), 1))
y_in = df["Adj Close"].tolist()

seg = Segmenter(x_in, y_in, n=20)
seg.calculate_segments()
For graphical output use Segmenter.plot_segments():
seg.plot_segments()
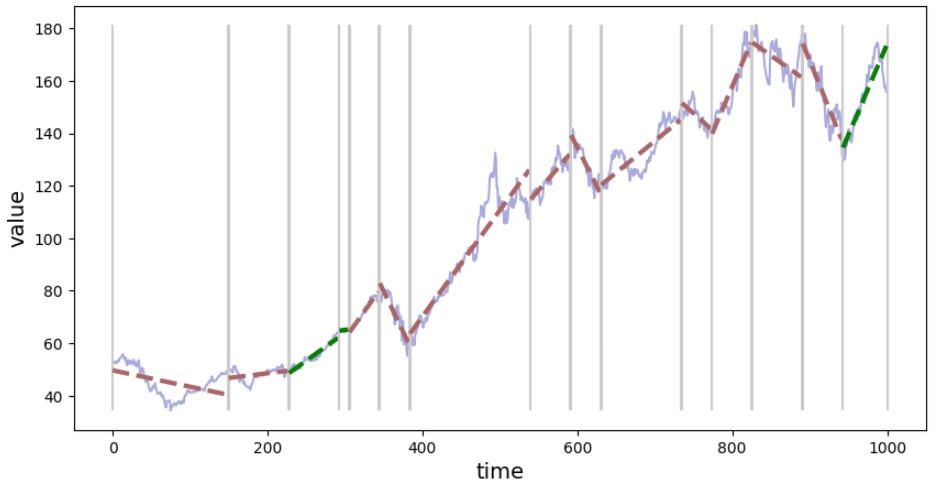
After calling method Segmenter.calculate_segments() segments are identified and information is stored in Segmenter.segments as list of Segment objects. Each Segment object. Each Segment object has attributes such as 'start', 'stop' - range of indices for the extracted segment, slope and many more attributes that might be helpful for further analysis.
Exemplary info on one segment:
from devtools import debug
debug(seg.segments[3])
and you should see something like this:
    seg.segments[3]: Segment(
        start=154,
        stop=177,
        slope=-0.37934038908585044,
        offset=109.54630934894907,
        slopes=[
            -0.45173184100846725,
            -0.22564684358754555,
            0.15555037018051593,
            0.34801127785130714,
        ],
        offsets=[
            121.65628807526804,
            83.56079272220015,
            17.32660986821478,
            -17.86417581658647,
        ],
        slopes_std=0.31334199799377654,
        offsets_std=54.60900279722876,
        std=0.933497081795997,
        span=82.0,
        reason_for_new_segment='offset',
    )
export results to tabular format (pandas DataFrame):
seg.segments.to_dataframe()

(NOTE: for clarity reasons, not all columns are shown in the screenshot above)
Alternative approach
- Smooth out the price data using the Savitzky-Golay filter,
- label the highs and lows.
- higher highs and higher lows indicates an uptrend.
The requirement here is than you need OHLC data for the assets you would like to analyse.
License
Release history Release notifications | RSS feed


Download files
Download the file for your platform. If you're not sure which to choose, learn more about installing packages.
Source Distribution
Built Distribution
Filter files by name, interpreter, ABI, and platform.
If you're not sure about the file name format, learn more about wheel file names.
Copy a direct link to the current filters
File details
Details for the file trend_classifier-0.2.0.tar.gz.
File metadata
- Download URL: trend_classifier-0.2.0.tar.gz
- Upload date:
- Size: 14.5 kB
- Tags: Source
- Uploaded using Trusted Publishing? No
- Uploaded via: twine/6.2.0 CPython/3.9.6
File hashes
| Algorithm | Hash digest | |
|---|---|---|
| SHA256 |
5e5ff913feba3f523c7533ae426348d6541b27a2f38fff4ebafc8a04079715c4
|
|
| MD5 |
0b958e3481f72b30020dc64a505ea2a3
|
|
| BLAKE2b-256 |
8268ad0b80213410d99022ba4c16629ef785ce8c1ffc6fcecc6ebd08eb74e004
|
File details
Details for the file trend_classifier-0.2.0-py3-none-any.whl.
File metadata
- Download URL: trend_classifier-0.2.0-py3-none-any.whl
- Upload date:
- Size: 11.8 kB
- Tags: Python 3
- Uploaded using Trusted Publishing? No
- Uploaded via: twine/6.2.0 CPython/3.9.6
File hashes
| Algorithm | Hash digest | |
|---|---|---|
| SHA256 |
3d2653fdf88d82e63a388cc5b60ed01df62eaa5d432dabe1f7028ee028d88765
|
|
| MD5 |
63a0c146ab5d6eabaf6b2fc9a2a99f43
|
|
| BLAKE2b-256 |
f638b9a8664d01476f2c398460347824bd675f5a956b08caf1518aea140d62fd
|


