
Local-first visual debugger for Python agents.
One HTML file. No cloud, no account. See LLM calls, tool calls, branches, errors, tokens, and cost.



Part of the Loom stack — local HTML traces for long-running agent loops.
Stack products: loom-run (dev) · loom-ops (ops) — --trace via loom-runner or @trace.
New: static context — possible vs actual execution
flow-xray now shows not just what happened in a run, but the nearby paths the source code allowed.
from flow_xray import trace
from flow_xray.static_index import build_index

result = trace.run(agent, query)
index = build_index([__file__])
result.to_html("trace.html", static_index=index)
Open trace.html and click "Show static context" in the Graph view:
- untaken branches (e.g. a tool that was never selected this run) render as dashed ghost nodes
- calls the static pass couldn't see — dynamic dispatch, decorators, monkey-patching — are marked runtime-only, not silently dropped
- click any node to see its static callers, static callees, and blast radius next to the usual runtime detail panel
This answers questions a plain runtime trace can't: was this the only branch that could have run, and what depends on the function that just broke? See examples/static_context_demo.py for a runnable scenario with a failing branch, an untaken alternative, and a dynamic call.
Loom stack
Overview: kroq86.github.io/loom-stack — packages, flow, audience, quick start.
The stack is a pyramid, not five equal frameworks. Tail-call optimization is the primitive, runner is the durable runtime, xray is the microscope, and the apps prove the stack in real workflows.
| Layer | Project | Job |
|---|---|---|
| Primitive | loom-tailcalls | Make async recursive/state-machine loops stack-safe |
| Runtime kernel | loom-runner | Make those loops durable, resumable, idempotent |
| Microscope | flow-xray ← this repo | Show what actually happened in one offline HTML trace |
| Proof app | loom-run | Chat agent reference implementation |
| Proof app | loom-ops | Ops/runbook agent reference implementation |
@tailrec agent loop  →  loom-runner run/resume  →  --trace trace.html
     (shape)                  (durability)              (flow-xray)
This repo is the microscope. It does not provide durability or agent
orchestration; it shows what actually happened. Use standalone with @trace,
or via loom-runner --trace / loom-run /
loom-ops --trace — no cloud account
required. Ecosystem: ECOSYSTEM.md
from flow_xray import trace

@trace
def call_llm(prompt):
    return openai.chat(prompt)

@trace
def agent(query):
    plan = call_llm(f"plan: {query}")
    return call_llm(f"answer based on: {plan}")

result = trace.run(agent, "weather in Tokyo?")
result.to_html("trace.html")
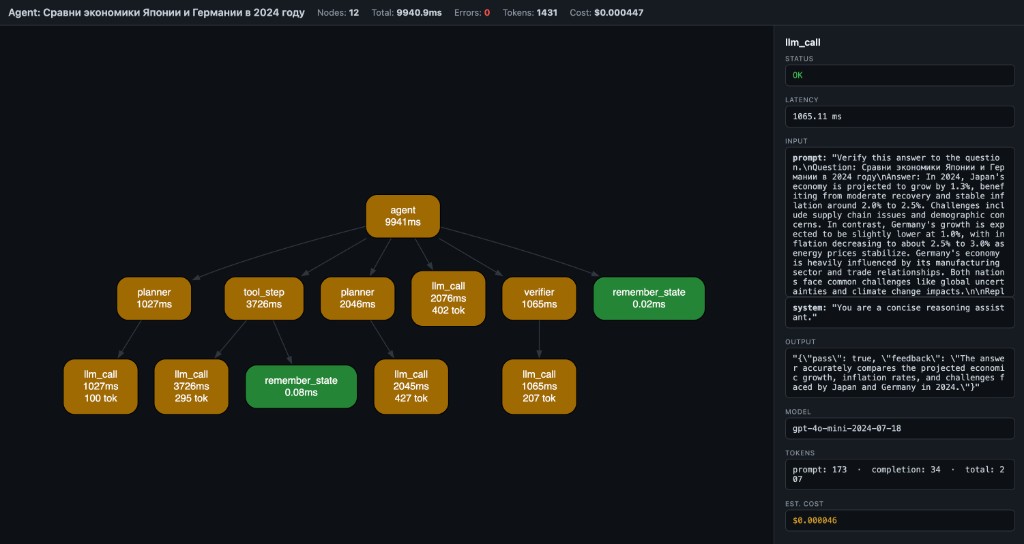
Open trace.html — you get a local debug artifact with:
- LLM calls
- tool calls
- branches and nested steps
- errors and retries
- tokens and estimated cost
- graph, timeline, overview, and raw trace views
No server, no account, no log viewer — one local HTML file.
The main use case
Your agent's final answer looks fine, but you do not trust the middle.
You want to see:
- which LLM calls happened
- which tool calls ran
- where the run branched or nested
- where an error or retry happened
- where tokens and cost accumulated
flow-xray is built for that exact debugging job.
Who this is for
flow-xray is most useful for:
- LangGraph users who want local tracing without hosted tooling
- LangChain users debugging tool calls and intermediate steps
- developers building Python tool-calling agents
- people who want one local trace artifact they can inspect or share after redaction
Install
pip install flow-xray
30-second quickstart
Create demo_trace.py:
from flow_xray import trace

@trace
def fetch_profile(user_id):
    return {"id": user_id, "plan": "pro"}

@trace
def answer_question(user_id):
    profile = fetch_profile(user_id)
    return f"user {profile['id']} is on {profile['plan']}"

result = trace.run(answer_question, 42)
result.to_html("demo_trace.html")
Run it:
python demo_trace.py
Open demo_trace.html in your browser. You should see one root node (answer_question) and one child node (fetch_profile).
When to use what
Use trace.run(...) when
- you control the function call directly
- you want the clearest Python API
- you want full control over arguments and return values
- you are tracing inside tests, scripts, notebooks, or app code
from flow_xray import trace

@trace
def pipeline(x):
    return x * 2

result = trace.run(pipeline, 5)
result.to_html("pipeline.html")
Use flow-xray run ... when
- you already have a Python script on disk
- you want a quick local trace without editing much code
- the traced calls already happen at module scope when the file is executed
flow-xray run my_agent.py --html trace.html
Usage
Decorator + trace.run
from flow_xray import trace

@trace
def step_a(x):
    return x + 1

@trace
def pipeline(x):
    return step_a(x) * 2

result = trace.run(pipeline, 5)
result.to_html("pipeline.html")
CLI
flow-xray run my_agent.py --html trace.html
The script must use @trace on the functions you want captured.
CLI onboarding
flow-xray run executes the file inside a trace session, but it does not enter if __name__ == "__main__" blocks.
That means:
- if your traced function call happens at module scope,
flow-xray runcan capture it directly - if your traced function call only happens inside
main()guarded byif __name__ == "__main__", the CLI may produce0 nodes
If you hit 0 nodes, use one of these fixes:
- Move a traced demo call to module scope for local debugging.
- Call
trace.run(...)inside the script instead. - Keep using the Python API directly from a small wrapper script.
Example that works with flow-xray run:
from flow_xray import trace

@trace
def step():
    return 1

step()
Example that will usually show 0 nodes with flow-xray run:
from flow_xray import trace

@trace
def step():
    return 1

if __name__ == "__main__":
    step()
Async support
@trace works with async def out of the box. Use trace.arun(...)
when you are already in async code:
import asyncio
from flow_xray import trace

@trace
async def call_api(query):
    await asyncio.sleep(0.1)  # simulate async I/O
    return {"answer": query}

@trace
async def agent(query):
    result = await call_api(query)
    return result["answer"]

result = await trace.arun(agent, "hello")
result.to_html("async_trace.html")
Token / cost tracking
Token usage and estimated cost are auto-extracted from OpenAI response objects, or you can set them manually:
@trace
def call_llm(prompt):
    resp = openai.chat.completions.create(...)
    trace.meta(model=resp.model,
               prompt_tokens=resp.usage.prompt_tokens,
               completion_tokens=resp.usage.completion_tokens)
    return resp.choices[0].message.content
Tracing a service: every request, on disk, with issues
trace.run captures one script run. For a service, keep a capture per request /
job and let flow-xray flag problems:
from flow_xray import TraceStore, trace
from flow_xray.asgi import TraceMiddleware

trace.configure(max_value_chars=100_000)          # keep full prompts
store = TraceStore("traces", retention_days=7, max_llm_calls=3)

app.add_middleware(TraceMiddleware, store=store)  # FastAPI / Starlette / any ASGI

with store.capture("job", "reindex", trace_id="job-42"):   # workers, scripts
    reindex()

async with store.acapture("mcp", "search", trace_id="call-42"):
    await search()                              # async tools / jobs

await store.asave(result, kind="eval", name="candidate")  # an existing TraceResult
ASGI captures through the final response byte (including SSE), then awaits the
JSON + HTML + index write in a dedicated two-thread pool. Callers await capacity;
traces are not dropped when the pool is busy. The pool is separate from asyncio's
default executor. capture() / save() remain synchronous and compatible.
Failures return None as before, but now log trace_save_failed and increment
store.save_failures. Append store.prometheus_metrics() to your application's
/metrics response to expose trace_save_failed_total; the library starts no
metrics server. A failed trace write does not replace the application's result.
Cancellation waits for the save attempt before propagating. Drain request/capture
tasks before stopping the event loop: Uvicorn's normal graceful shutdown does this
for ASGI requests. SIGKILL, a hard shutdown deadline, disk failure, or stopping the
loop with unfinished captures can still lose a trace; there is no durable spool
or fsync-based crash guarantee. Draining depends on storage making progress.
Do not mutate a TraceResult while its asave() is pending. See
the persistence checks and bounded measurement.
flow-xray report traces --issues # recent runs: duration, LLM calls, tokens, issues, HTML path
Built-in issue checks: errors (reported where raised), slow nodes, calls repeated with
identical inputs, too many model calls; add your own with TraceStore(rules=[...]).
Redaction and share-safe traces
Use decorator options when a trace may contain secrets or bulky payloads:
from flow_xray import trace

@trace(redact={"api_key", "authorization"}, capture_output=False)
def call_service(api_key, payload):
    ...
redact={...}masks matching argument names and nested dict keys as[redacted]capture_output=Falsekeeps the real return value in Python, but stores[redacted]in the HTML trace
Safety and sharing
flow-xray serializes trace data into the generated HTML file.
By default, that can include:
- function names
- bound inputs
- outputs
- exceptions
- attached
trace.meta(...)fields - token and cost metadata
Use the privacy controls when you want a trace that is safer to share:
redact={...}hides matching input names and nested dict keys as[redacted]capture_output=Falsekeeps the real Python return value, but writes[redacted]into the HTML trace
Treat trace files as local debugging artifacts unless you have explicitly reviewed or redacted their contents. A trace is generally safer to share when you have:
- redacted secrets, auth headers, API keys, or user data
- hidden sensitive outputs with
capture_output=False - checked the generated HTML once before posting it publicly
Why not LangSmith or plain logs?
Use flow-xray when you want
- local-first debugging
- one HTML file you can open immediately
- graph and timeline views, not only logs
- no account and no hosted tracing requirement
Use plain logs when you want
- quick event-level debugging
- a tiny amount of output
- no structured trace at all
Use hosted tracing tools when you want
- team dashboards
- long-term trace storage
- production monitoring
- centralized evaluation workflows
flow-xray is best when your question is:
What actually happened inside this Python agent run, locally, right now?
What you see
- Nodes = function calls (name + latency + tokens)
- Edges = caller → callee
- Green = OK, Red = error, Yellow = slow (>1s)
- Header = total nodes, latency, tokens, estimated cost
- Click a node → side panel shows inputs, output, error, timing, model, tokens, cost
Why this exists
Langfuse, Helicone, LangSmith — they give you timelines and logs.
But when your agent pipeline branches, retries, or chains 6 tools — you don't need another table. You need a graph.
flow-xray is not an agent framework. It's the layer below them — like Chrome DevTools is to browsers.
Docs
Compatibility
- Python 3.10, 3.11, 3.12, 3.13, 3.14 — tested
- Sync and async functions — both supported
- Any Python code — not limited to LLM calls; works with any function you decorate
- Frameworks — works alongside LangGraph, CrewAI, OpenAI SDK, or plain Python
How it works
@trace wraps functions (sync and async). When called inside a trace.run() session (or flow-xray run CLI), it records:
- function name
- bound arguments
- return value or exception
- wall-clock latency
- token usage and estimated cost (auto or manual)
- parent/child relationships (call stack → DAG)
result.to_html() embeds the trace as JSON in a self-contained HTML page that renders via WASM Graphviz (CDN, works offline after first load).
The trace viewer also includes search, zoom/reset controls, and copy-details for the currently selected node.
Also included
Scalar autodiff core (micrograd-style Value graph with DOT/JSON export and stepping debugger) lives under flow-xray dot CLI and from flow_xray import Value. See examples/ and plan.md.
License
MIT
Latency budgets by node kind
TraceStore(..., slow_ms_by_kind={"retrieval": 100, "embedding": 1000, "llm": 5000})
(or analyze(result, slow_ms_by_kind=...)) flags operations against their own
budget. Set kinds with @trace(kind="retrieval"); model metadata implies llm
only when an explicit kind is absent. Configured kinds include child time.
Other nodes retain the existing slow_ms=5000 leaf-only check. Findings include
node_kind and threshold_ms; recorded call trees are unchanged.
Traffic lights for every measured node
For a uniform 50 ms inspection threshold use
TraceStore(..., slow_ms=50, slow_all_nodes=True). Every recorded call,
including parents and model calls, is checked. slow_node findings contain
node_id, elapsed_ms, self_ms, threshold_ms and warning severity.
The existing leaf-only default and optional kind overrides remain available.
The stored HTML uses the store's thresholds. Direct TraceResult.to_html()
and to_dot() use 50 ms by default (configurable via slow_ms and
slow_ms_by_kind). Green means at or below threshold, yellow means above,
red means an exception. The overview lists all above-threshold nodes,
ordered by self wall time, and each entry opens that exact call. Timeline,
graph and Gantt use the same classification. Exactly 50 ms is green. Displayed times are rounded to 0.001 ms;
classification uses unrounded clock values.
Self wall time subtracts the union of recorded child intervals, clipped to the parent. Parallel children are not double-counted. It includes waits, scheduler delay and uninstrumented work: neither elapsed nor self wall time proves CPU cost or event-loop blocking. A slow LLM call is a signal to inspect, not automatically a defect. Only instrumented nodes are observable. Existing saved HTML/index rows retain their old viewer/findings; new saves use this policy. Full trace JSON, inputs, outputs and metadata remain unchanged.
Optional DOM regression (install jsdom outside the runtime environment):
FLOW_XRAY_JSDOM=/path/to/node_modules/jsdom python -m pytest tests/test_html_dom.py.
The network renderer is stubbed there; viewer classification/navigation runs.
1 maintainer

Metadata
1 maintainer
Release files for flow-xray 0.5.0
For a detailed explanation of source distributions (sdists) and built distributions (wheels), please see the package formats documentation.
Source distribution (sdist)
| File | Size | Uploaded | |
|---|---|---|---|
| flow_xray-0.5.0.tar.gz | 59.6 kB | Details |
Built distribution (wheel)
| File | Interpreter | ABI | Platform | Reset |
|---|---|---|---|---|
| flow_xray-0.5.0-py3-none-any.whl | Python 3 | none | any | Details |
Total release size: 115.4 kB
Release files / flow_xray-0.5.0.tar.gz
| Download URL | flow_xray-0.5.0.tar.gz |
|---|---|
| Size | 59.6 kB |
| Tags | Source |
|
SHA-256 checksum How to use checksums |
4bc1b54bdaffc16b83f942a98bbe203141fd58e13af24b5a91b412346db5bec9
|
|
BLAKE2b-256 checksum How to use checksums |
25caf22f10df8f2736596e2a14603bb7e2842828c473ffc0434a6745eba7134e
|
| Upload date | |
|
Uploaded using Trusted Publishing? What is trusted publishing? |
No |
| Uploaded via |
twine/7.0.0 CPython/3.13.14
|
Release files / flow_xray-0.5.0-py3-none-any.whl
| Download URL | flow_xray-0.5.0-py3-none-any.whl |
|---|---|
| Size | 55.8 kB |
| Tags | Python 3 |
|
SHA-256 checksum How to use checksums |
46dca89f3e452b369c8d501c49d2a1b58d22e5771ea8bfff1c18d60cd1d79bb9
|
|
BLAKE2b-256 checksum How to use checksums |
61c1240f671754f45489c1c0db3dc0ba97df8e6ca1aef9e49259ab92c816499c
|
| Upload date | |
|
Uploaded using Trusted Publishing? What is trusted publishing? |
No |
| Uploaded via |
twine/7.0.0 CPython/3.13.14
|














