
🚀 Ground Control - The Ultimate Terminal System Monitor
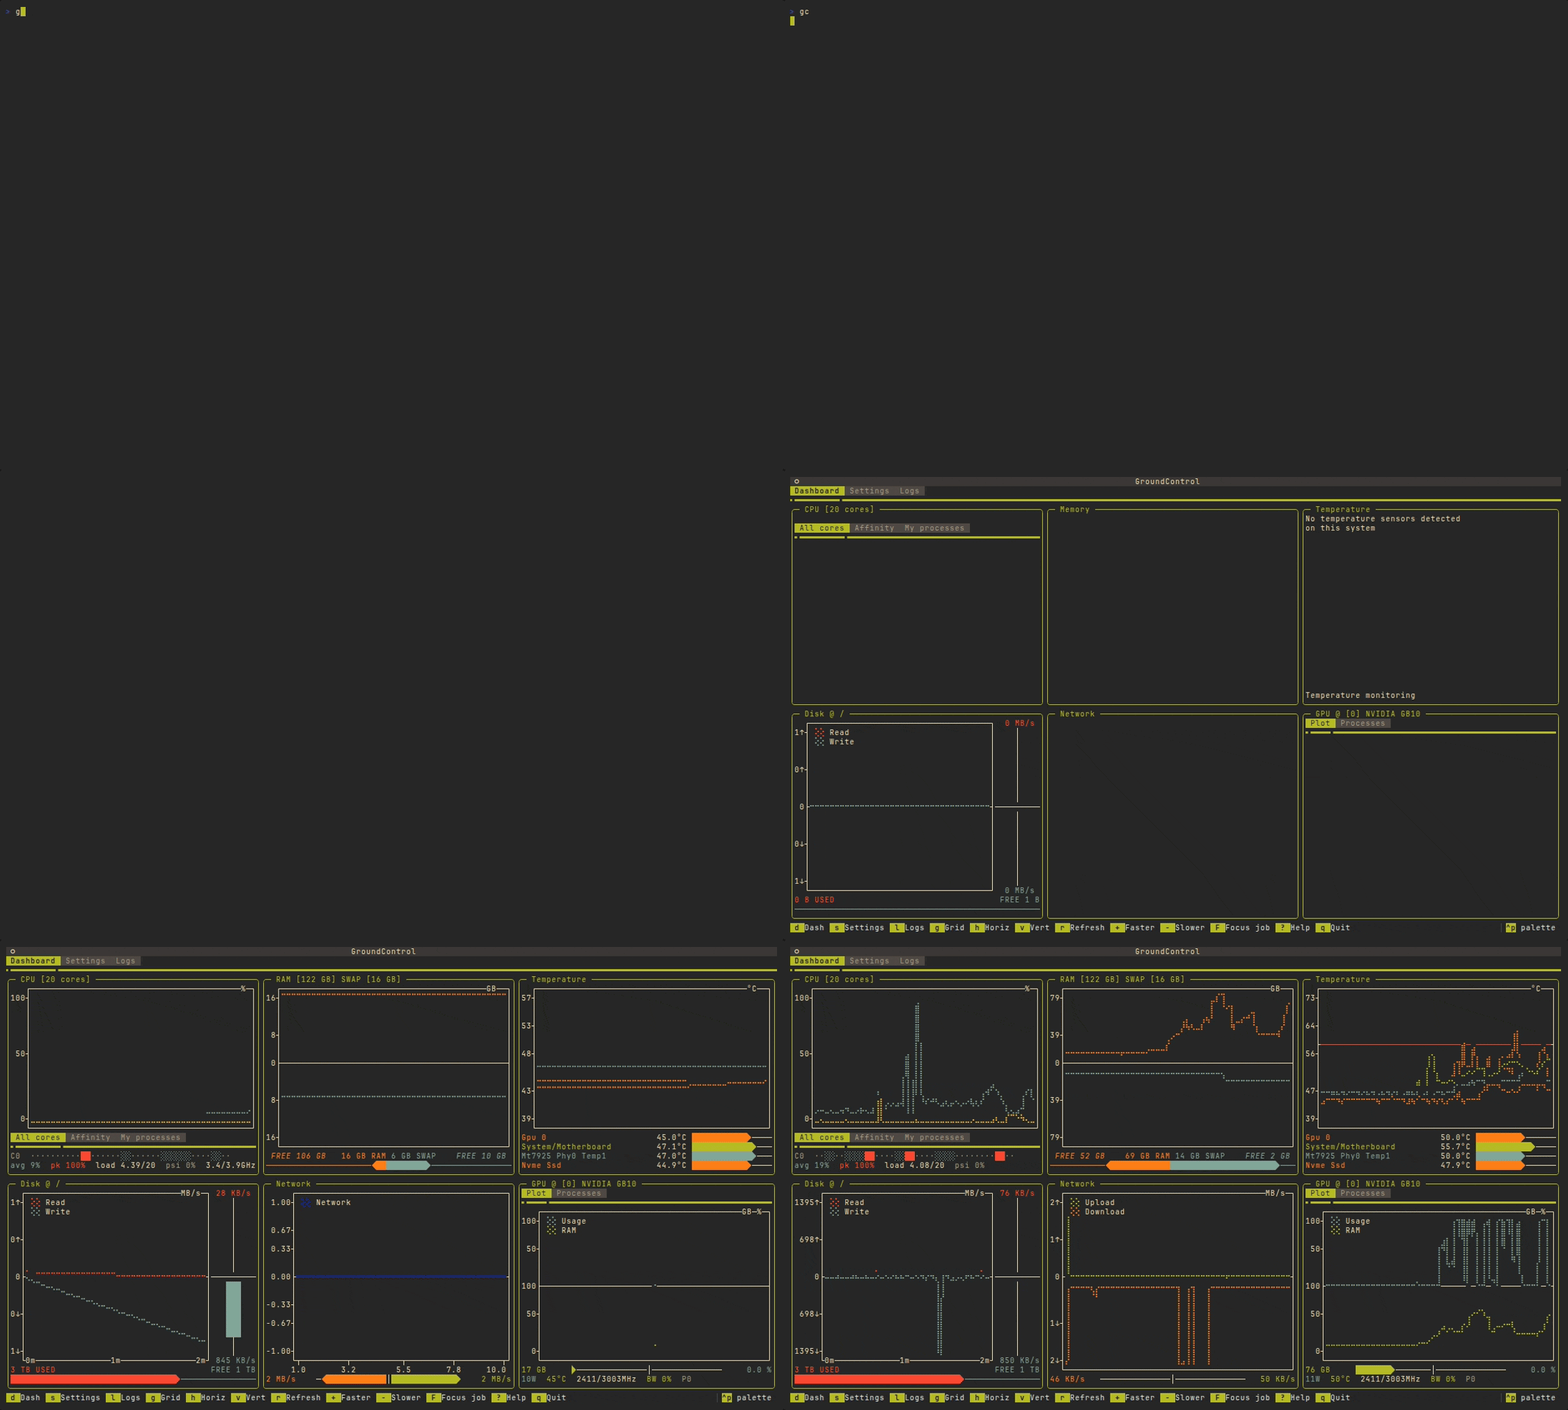


Ground Control is a sleek, real-time terminal-based system monitor built with Textual, Plotext and the nvitop API. It provides a powerful, aesthetic, customizable interface for tracking CPU, memory, disk, network, GPU usage, and system temperatures — all in a visually appealing and responsive TUI.
Ground Control works optimally with TMUX, install it here!
We tested Ground Control with the Windows Terminal app, Tabby and the VSCode integrated terminal. Monospaced fonts are preferred.
🌟 Features
📊 Real-Time System Monitoring
- CPU Usage: Per-core load tracking with frequency stats and detailed performance metrics.
- Memory Utilization: RAM usage with dynamic visualization and memory statistics.
- Temperature Monitoring: Real-time system temperature tracking with thermal status indicators.
- Disk I/O: Monitor read/write speeds and disk usage with comprehensive storage metrics.
- Network Traffic: Live upload/download speeds with bandwidth utilization graphs.
- GPU Metrics: Real-time NVIDIA GPU monitoring with utilization and memory tracking (if available).
🖥️ Responsive Layout
- Automatic resizing to fit your terminal window.
- Multiple layouts: Grid, Horizontal, and Vertical.
- Customizable widgets: Show only the metrics you need with granular control.
🎛️ Interactive Controls
- Keyboard shortcuts for quick navigation.
- Toggle between different layouts instantly.
- Customize displayed metrics via a built-in selection panel with individual widget control.
🛠️ Installation
🔹 Install via PyPI
pip install ground-control-tui
🔹 Install from Source
git clone https://github.com/alberto-rota/ground-control
cd ground-control
pip install -e .
🚀 Getting Started
🔹 Run Ground Control
Once installed, simply launch Ground Control with:
groundcontrol
or
gc
🔹 Available Layouts
Grid Layout
A structured layout displaying all widgets neatly in a grid. When you first launch Ground Control, it will show this layout — every panel the machine has to offer, on screen at once.
Horizontal Layout
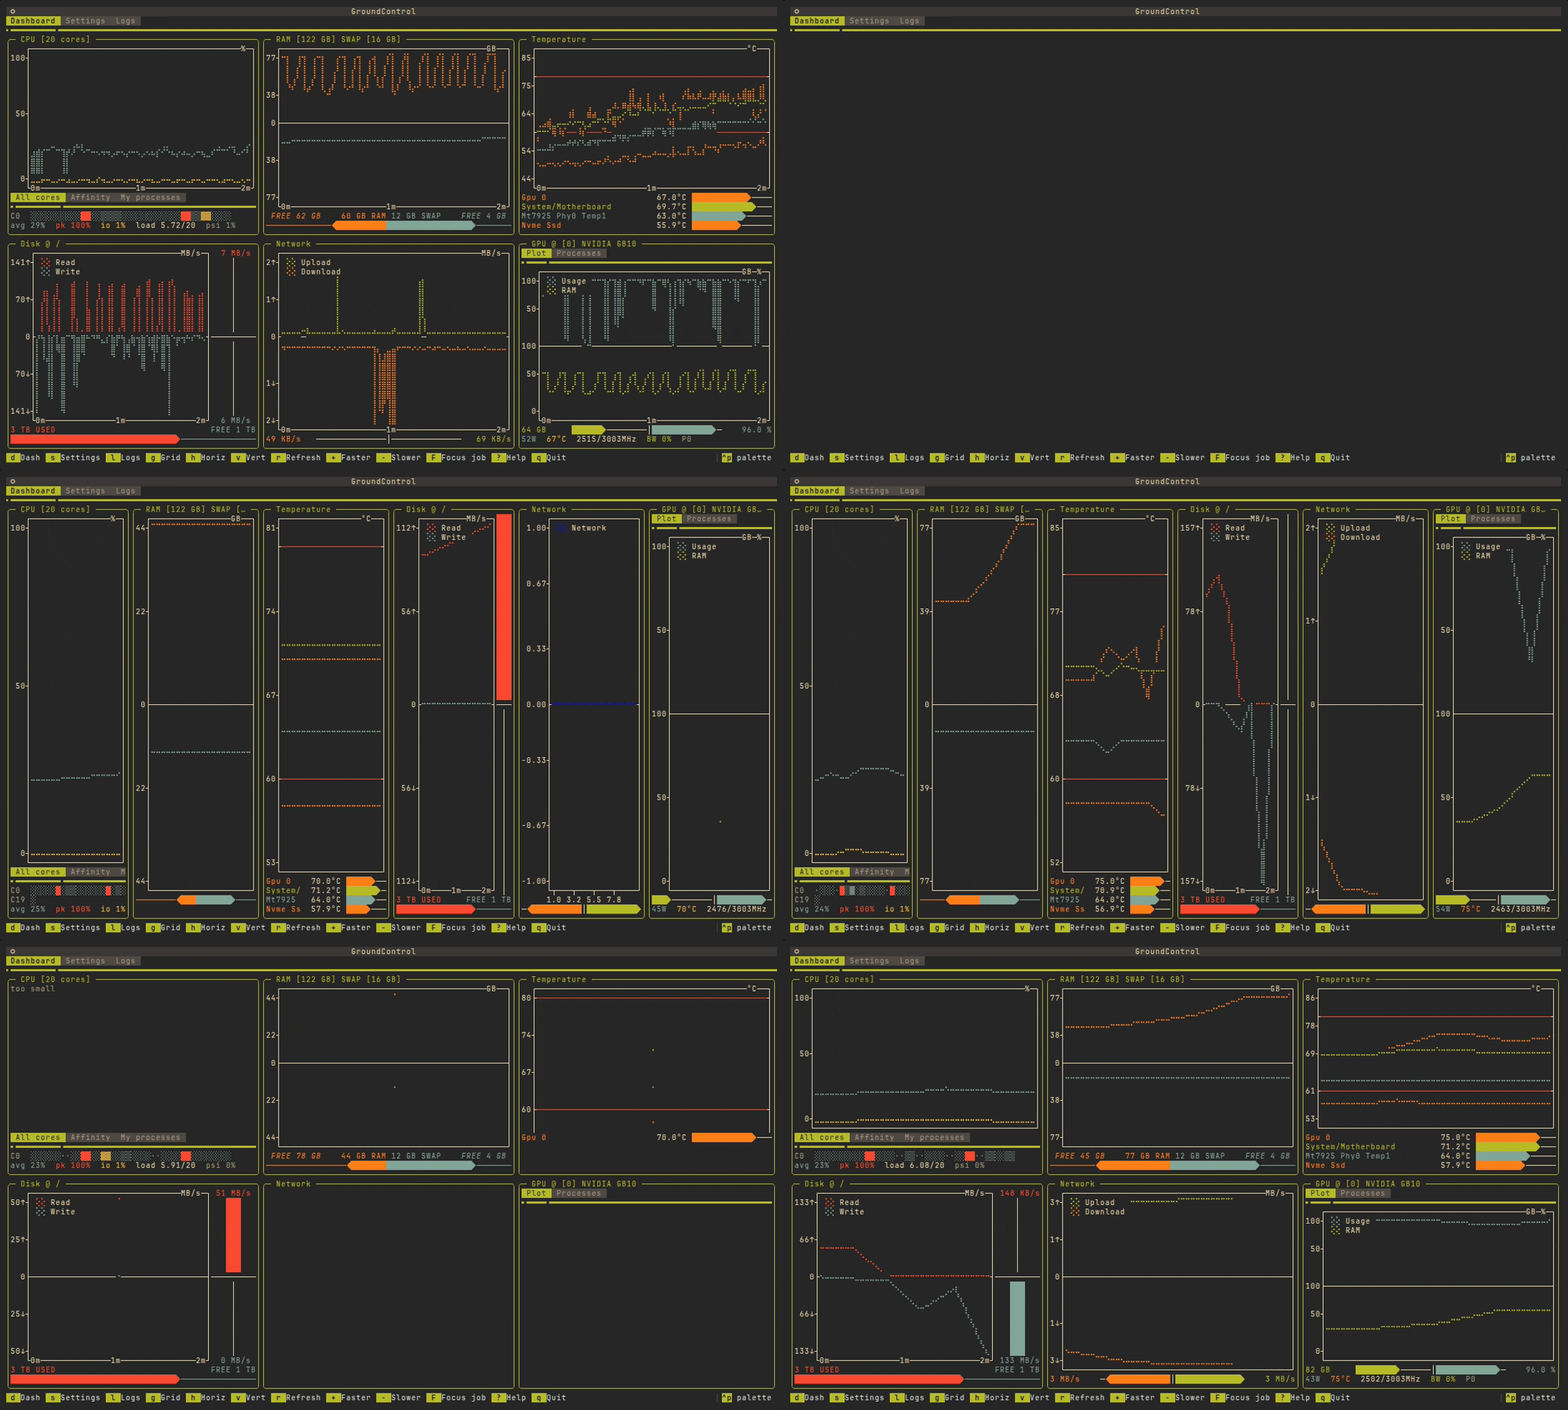
All widgets aligned in a single row. If you like working with wide shell spaces, split a TMUX session horizontally and use this layout! The recording below switches grid → horizontal → grid with g and h, on live data.
Vertical Layout
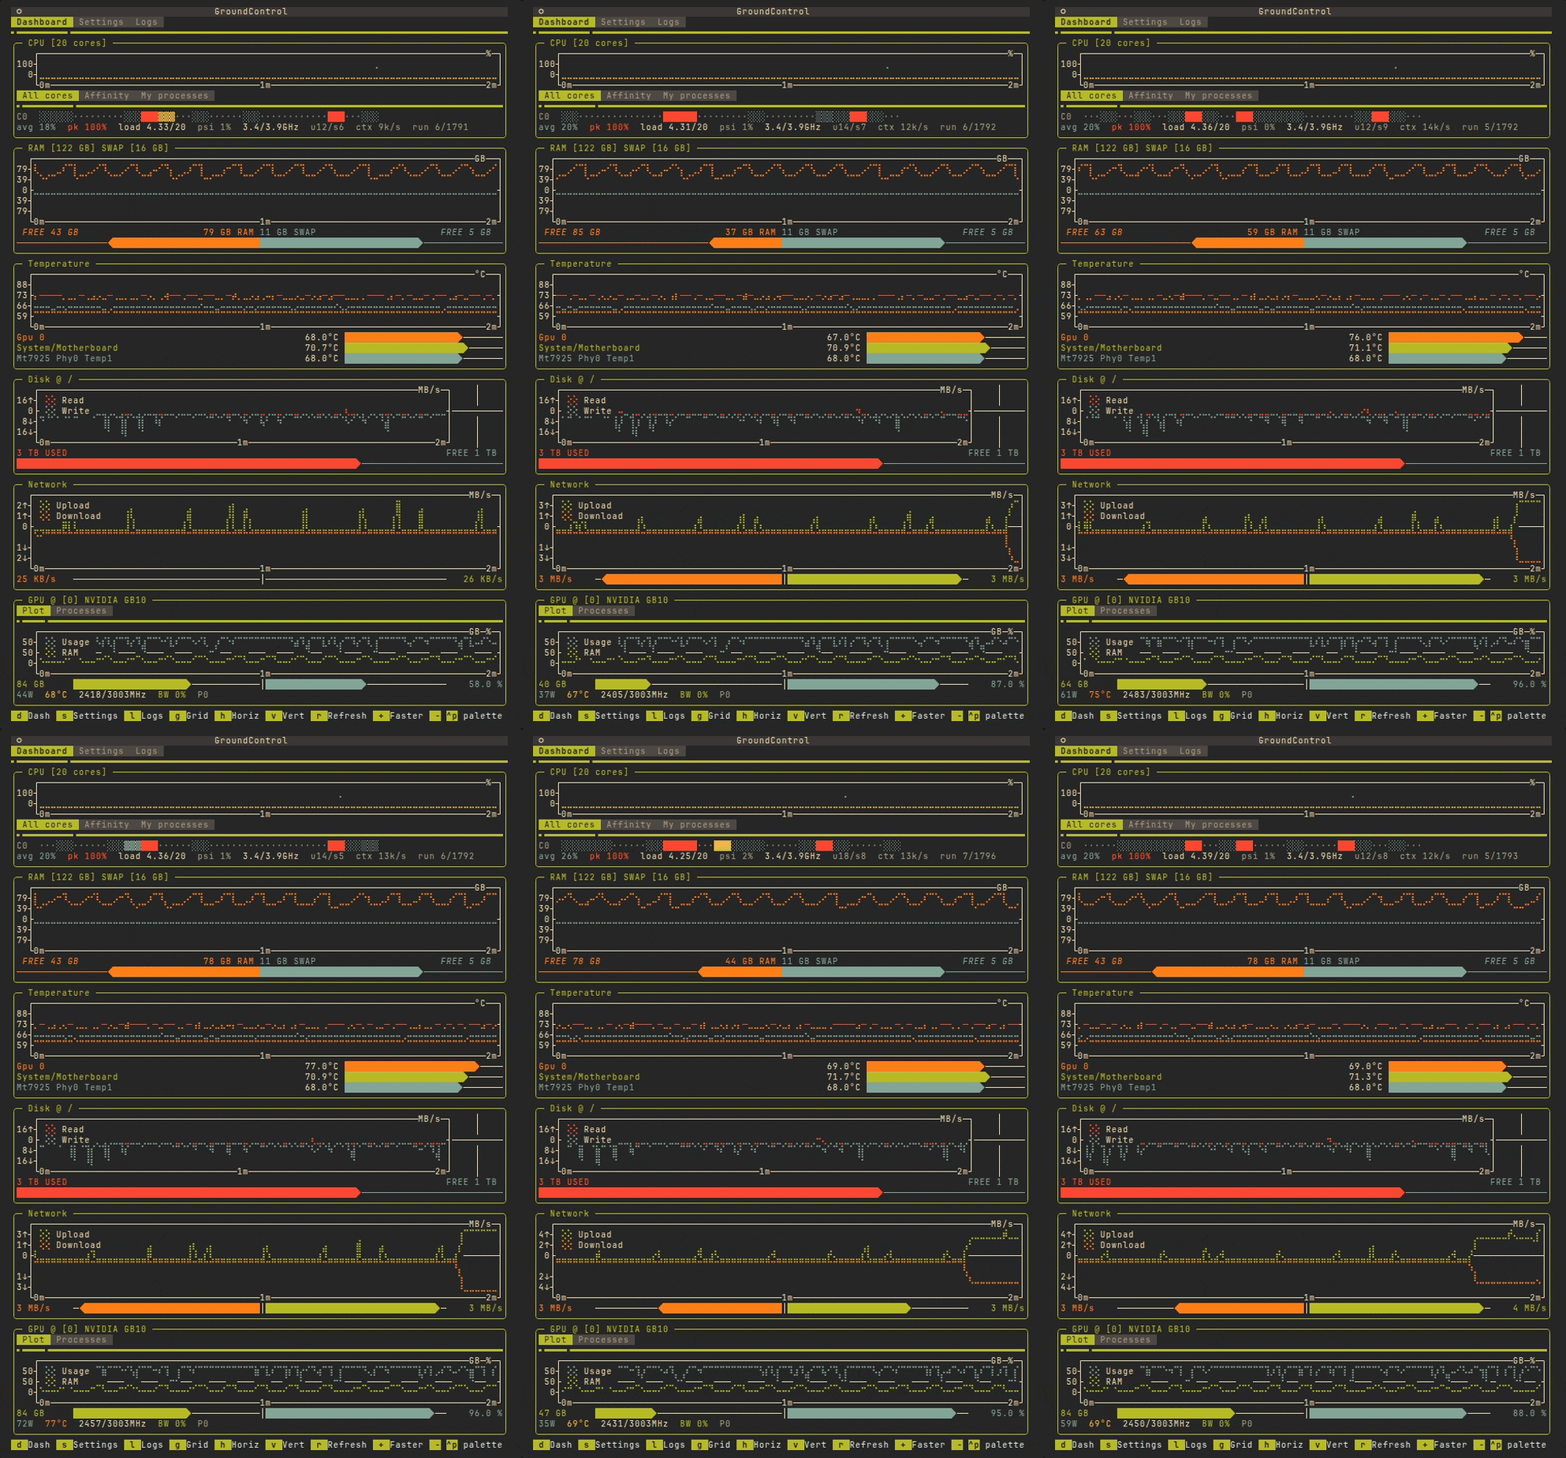
A column-based layout, ideal for narrow shell spaces. If you like working with tall shell spaces, split a TMUX session verticall and use this layout!
🖥️ Widget Breakdown
Each panel in Ground Control represents a different system metric:
🔹 CPU Usage
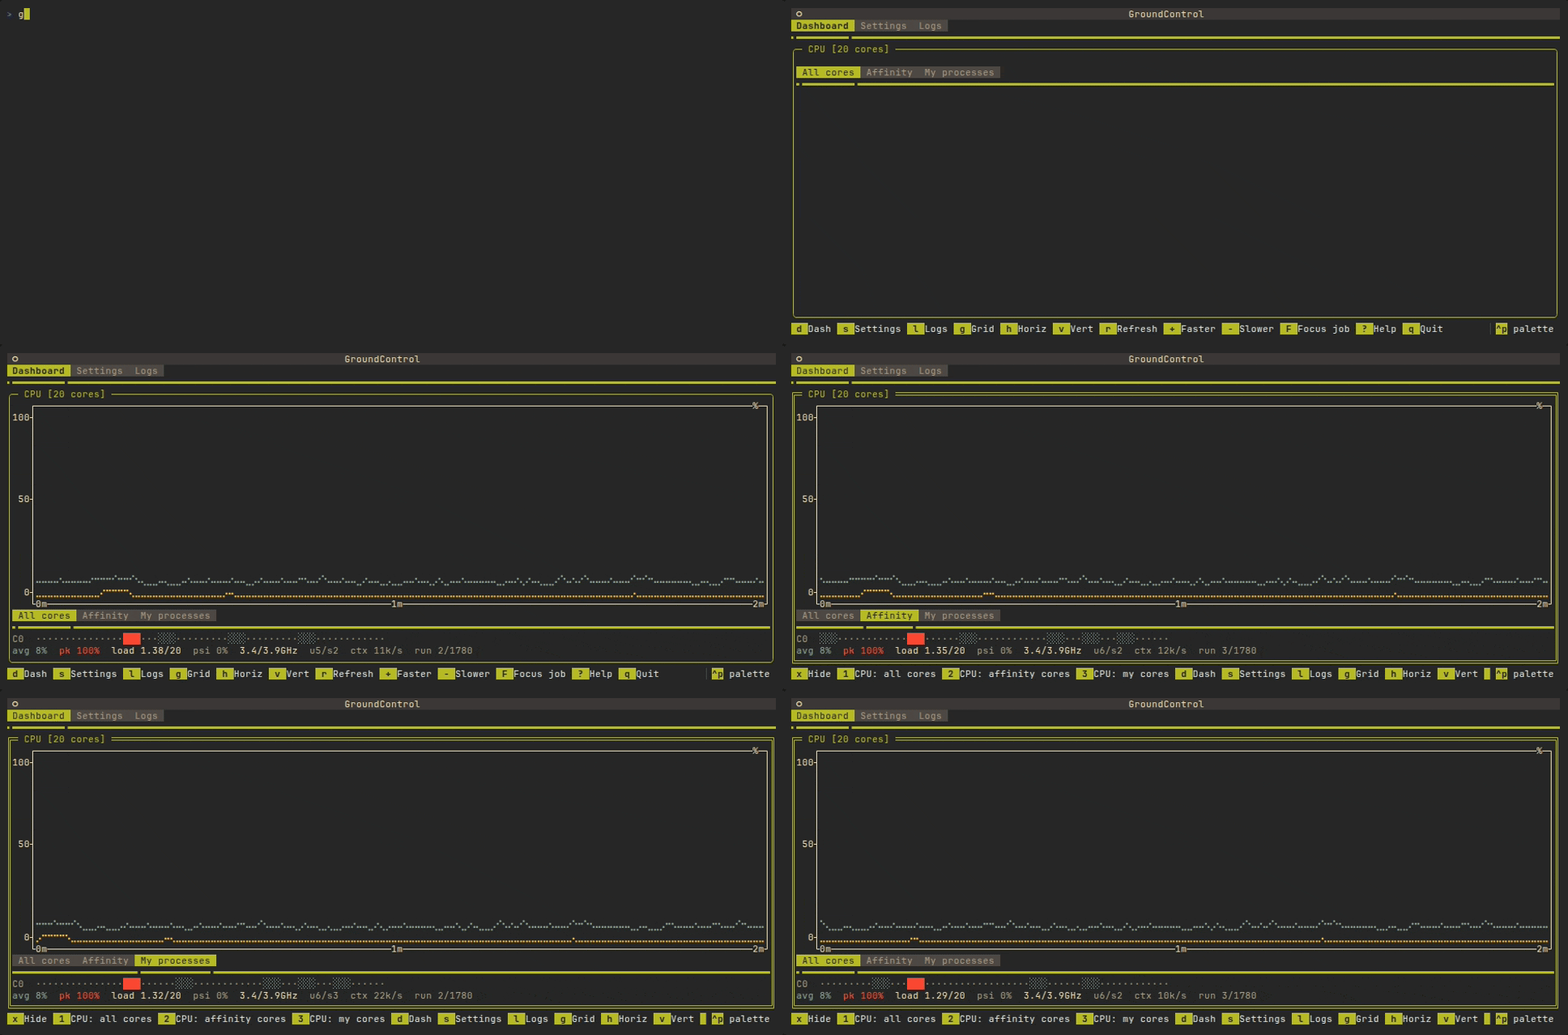
- Shows per-core CPU usage as horizontal bars (0-100%)
- Displays each core's utilization in a compact bar chart format
- Updates in real-time with color-coded bars showing load intensity
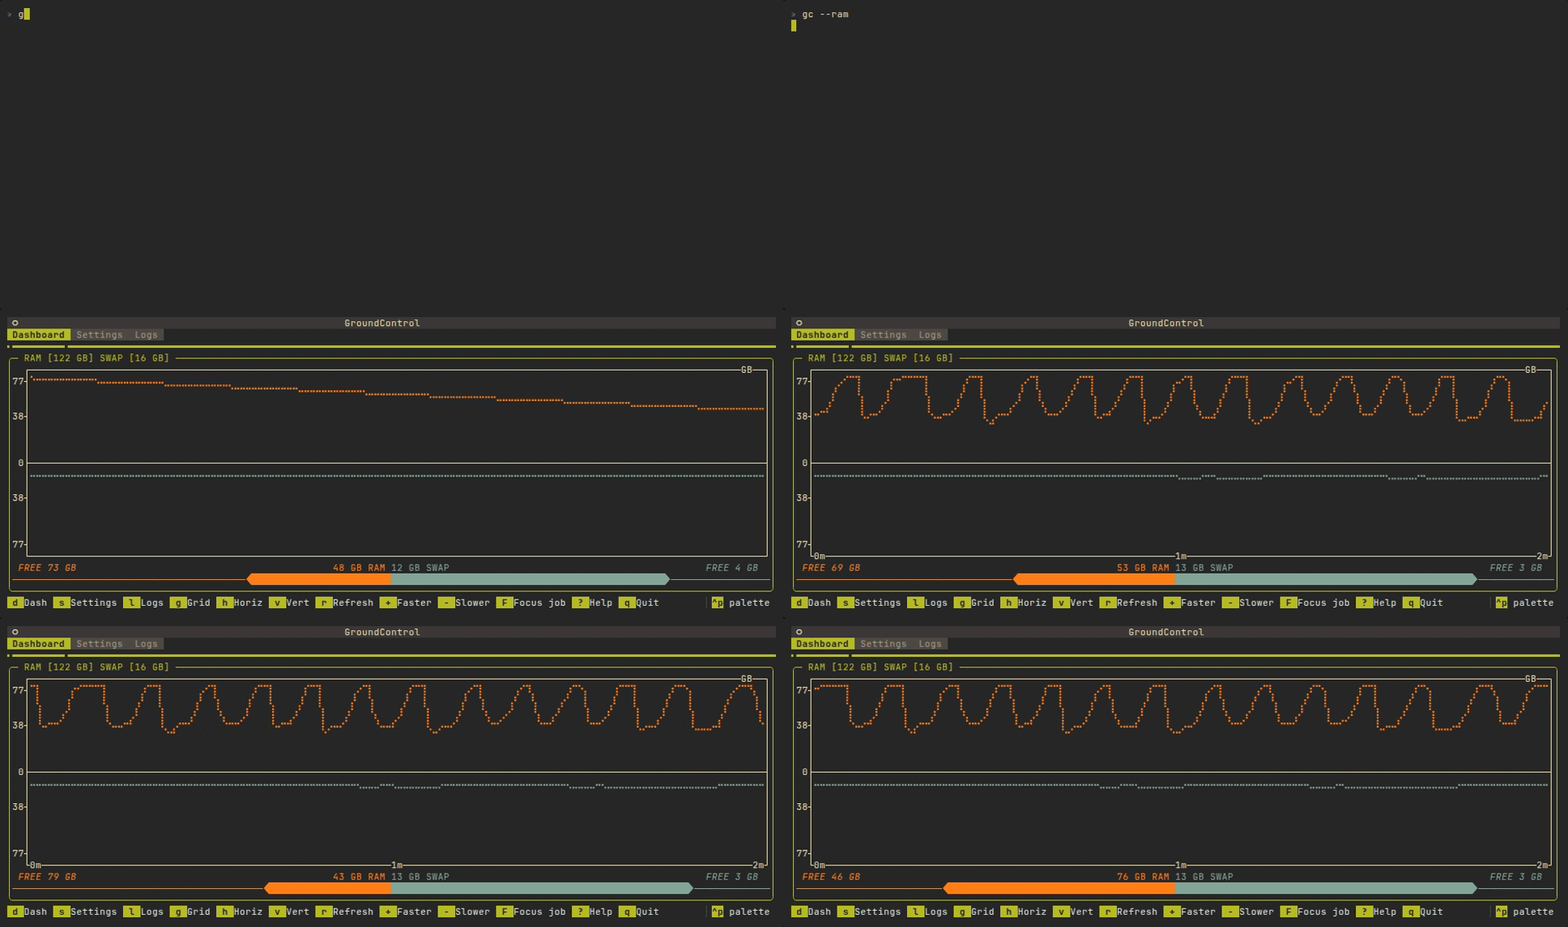
🔹 Memory Utilization
- Dual plot showing RAM (positive axis) and SWAP (negative axis) usage in GB
- Center bar with color-coded sections showing used/free RAM and SWAP
- Title displays total RAM and SWAP capacity in GB
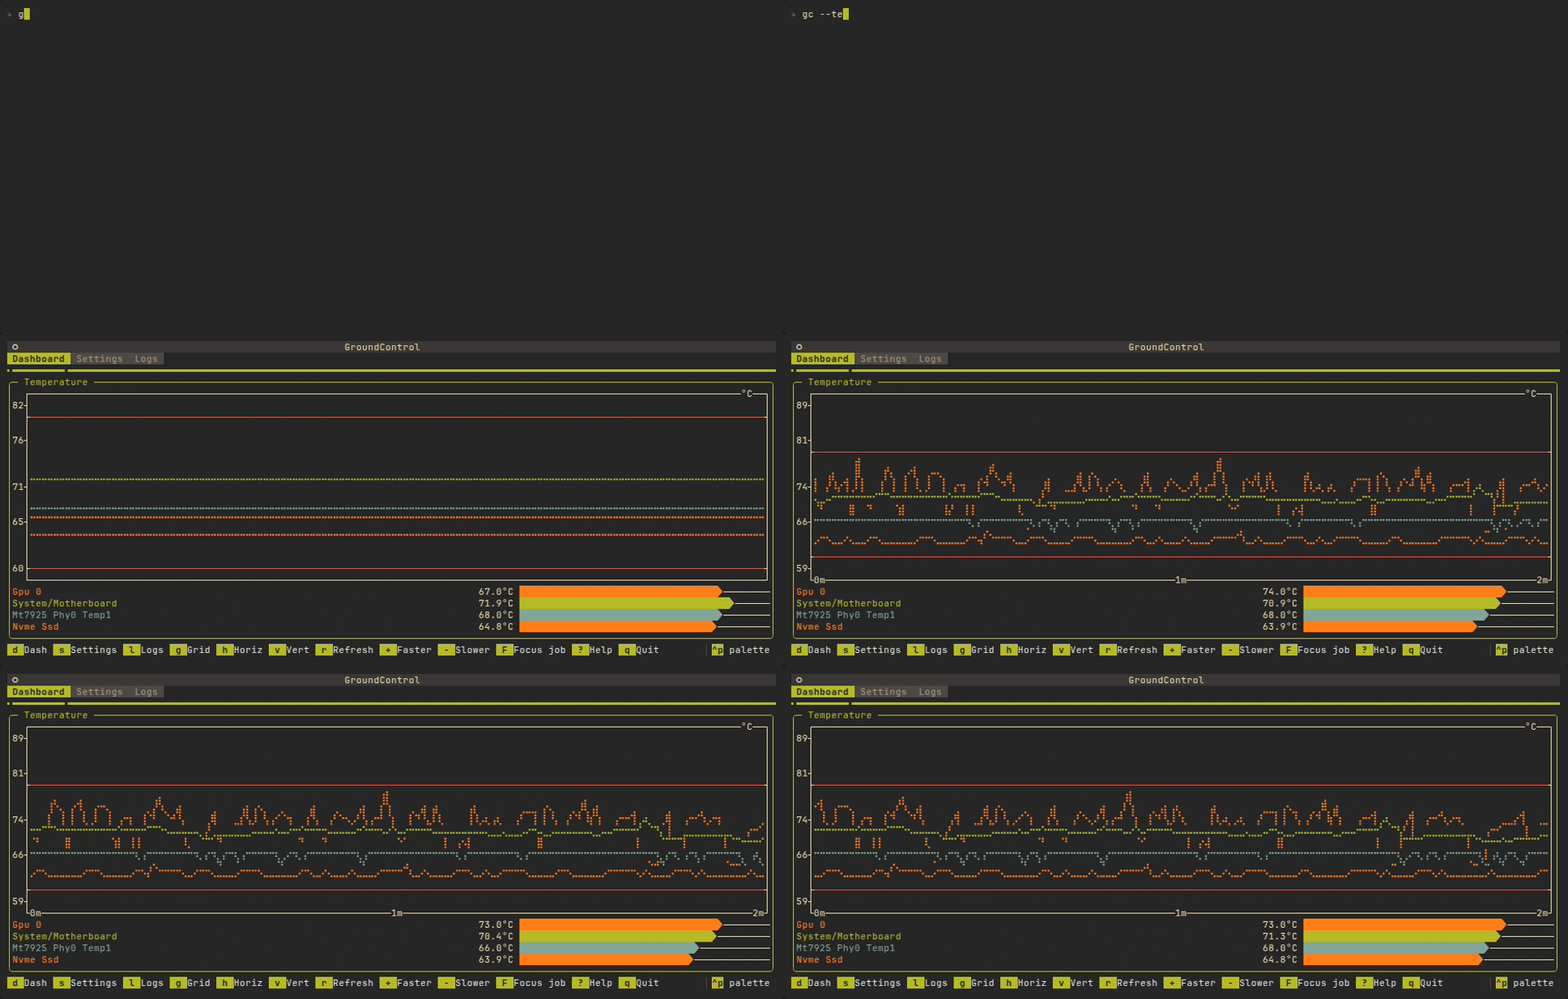
🔹 Temperature Monitoring
- Multi-line plot tracking temperature over time in °C for up to 4 key sensors
- Color-coded warning thresholds at 60°C (orange) and 80°C (red)
- Right panel shows current temperatures with dynamic color bars based on heat levels
- Prioritizes CPU, GPU, and motherboard sensors
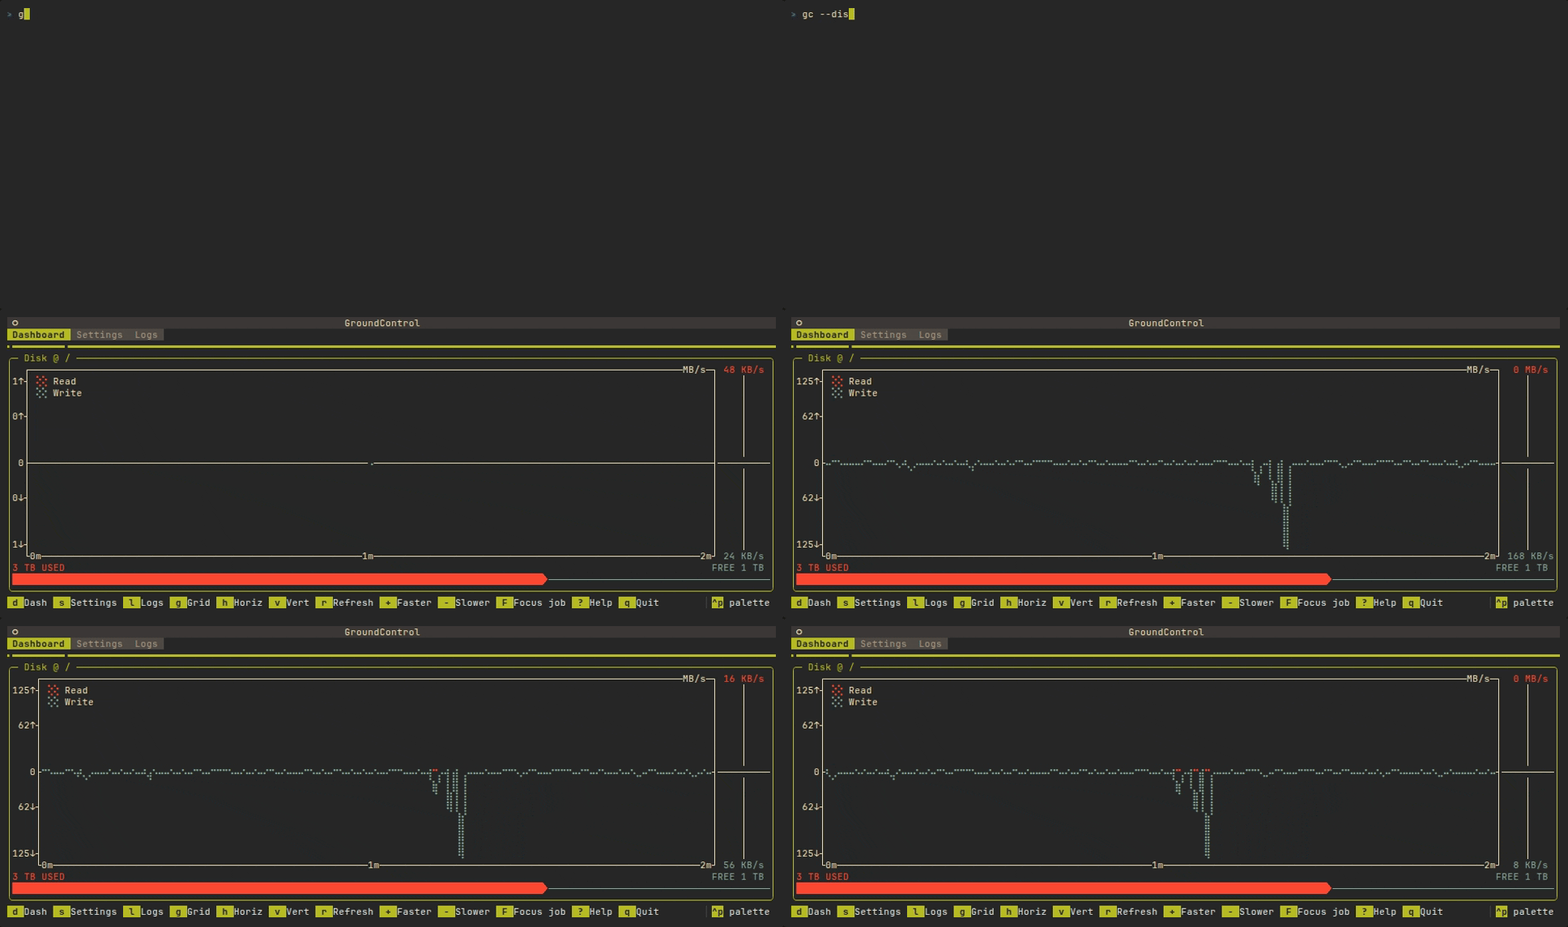
🔹 Disk I/O
- Dual plot showing read (positive axis) and write (negative axis) speeds for each mounted disk/partition
- Shows disk usage with color-coded bar for used/free space in GB
- Updates in real-time with throughput history
- Each mounted disk/partition gets its own widget (except boot/EFI partitions)
- Automatically detects and displays all mounted disks and partitions
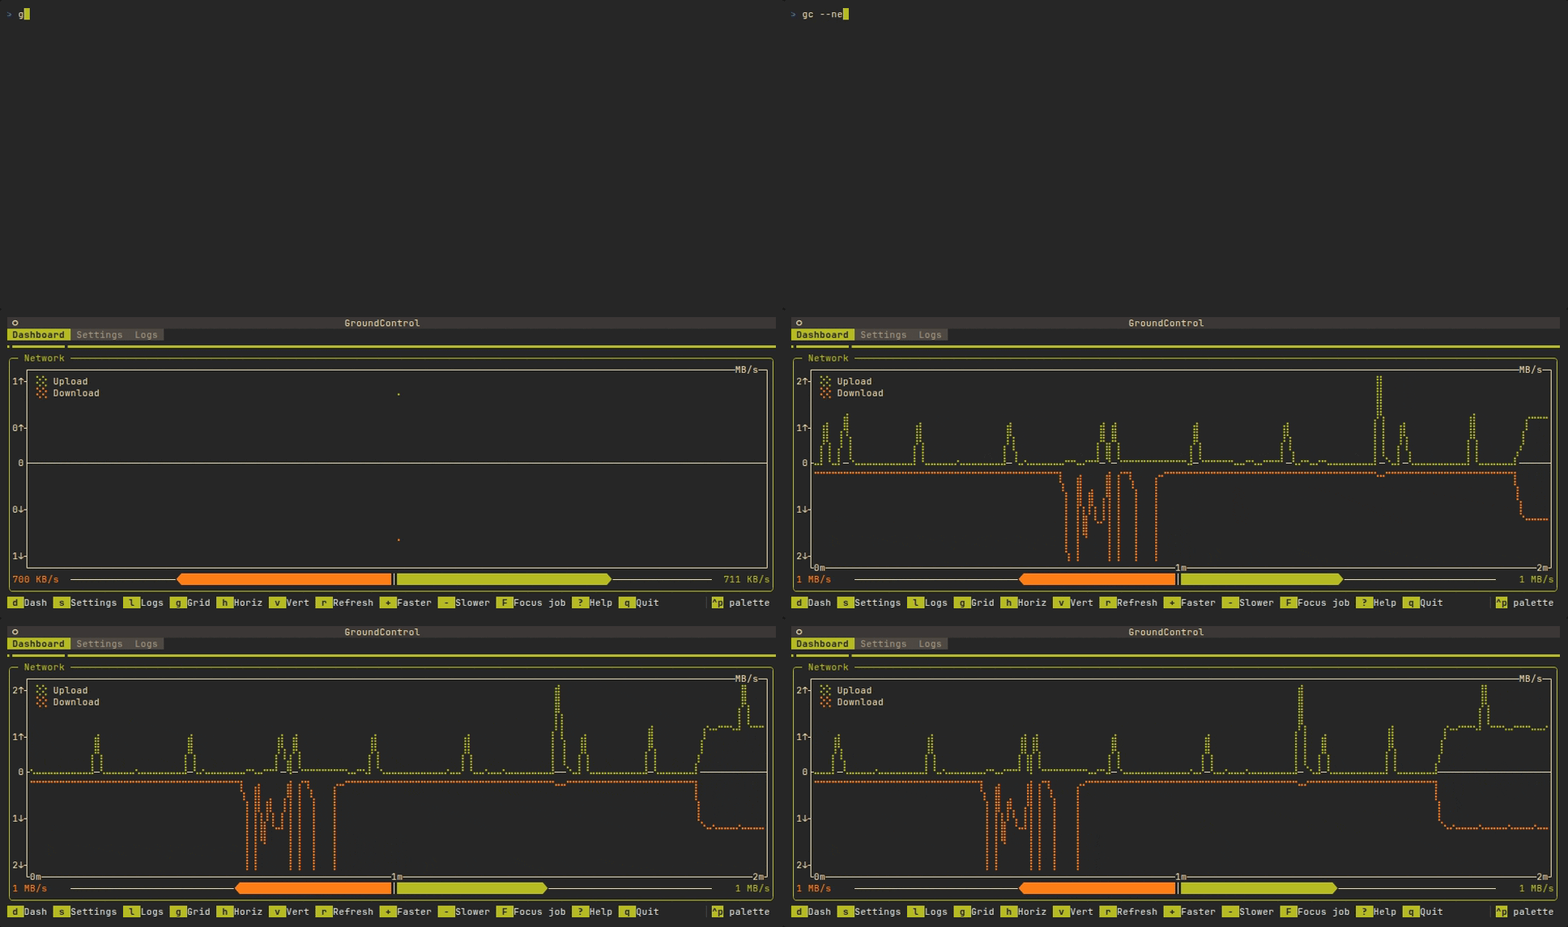
🔹 Network Traffic
- Dual plot showing upload (positive axis) and download (negative axis) speeds
- Shows current transfer rates with color-coded indicators
- Tracks cumulative data transfer amounts
🔹 GPU Metrics (NVIDIA Only)
- Dual plot showing GPU usage % (positive axis) and memory usage GB (negative axis)
- Center bar displays current GPU memory usage (GB) and utilization (%)
- A telemetry line underneath reports power draw against its limit, temperature, SM clock, memory-bandwidth utilization and any clock-throttle reason
- Shows "Usage UNAV" when GPU utilization cannot be detected
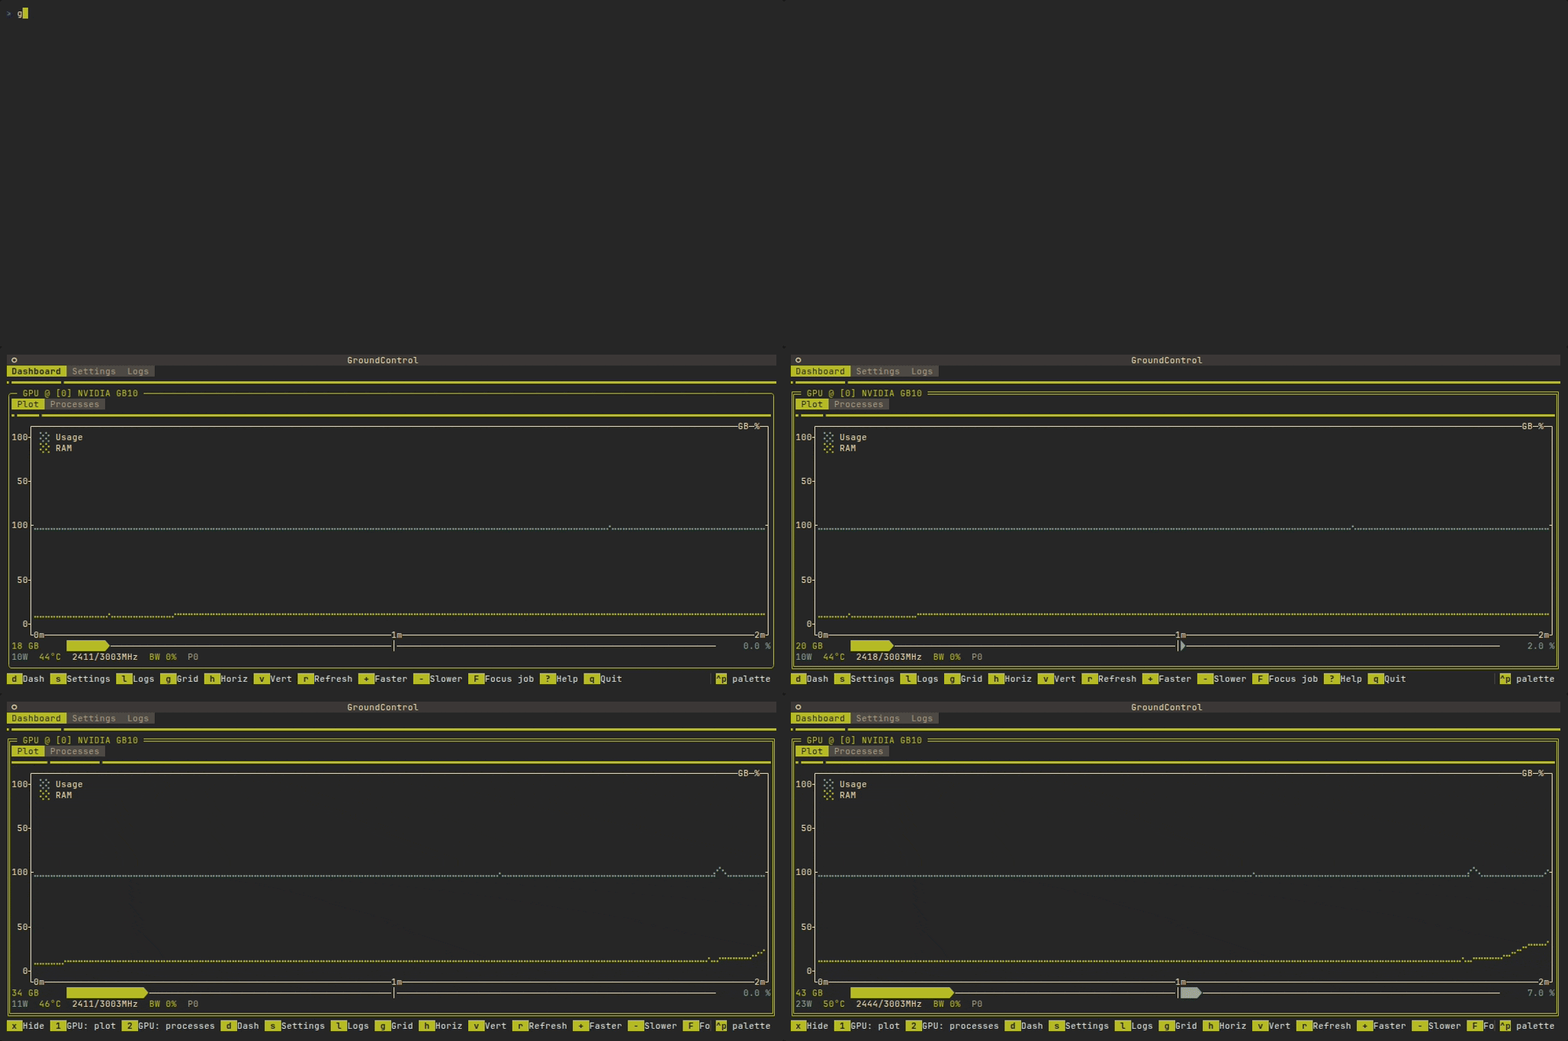
🔹 Slurm Jobs
Shown automatically wherever squeue is on PATH — no flag needed (gc --slurm shows only this panel, like the other widget filters).
- Lists all of your jobs, running and pending, one row each: id, state, elapsed/limit time, node, CPUs, memory, GPUs, partition and name. Narrow panels drop the least important columns instead of wrapping.
- A second line per job carries the time-limit gauge (how close the job is to being killed) and live
sstatusage for running jobs. - Three buttons per row:
- F — focus: point every panel at that job. Ground Control starts a collector inside the job's allocation, so CPU, memory, GPU and process panels show the compute node's view of the job instead of the login node's. Focus ends by itself when the job does, naming its final state (
COMPLETED,FAILED,TIMEOUT,CANCELLED). - O — output: read the job's
stdout/stderr, tailing the last 64 KB and following it live. ANSI colours in the log are rendered, not printed. - C — cancel:
scancelthe job. Press once to arm (the button turns red), again within four seconds to confirm.
- F — focus: point every panel at that job. Ground Control starts a collector inside the job's allocation, so CPU, memory, GPU and process panels show the compute node's view of the job instead of the login node's. Focus ends by itself when the job does, naming its final state (
F from anywhere opens a list of your running jobs: arrow to one and press enter to focus it, u to stop focusing.
🔹 Threshold Alerts
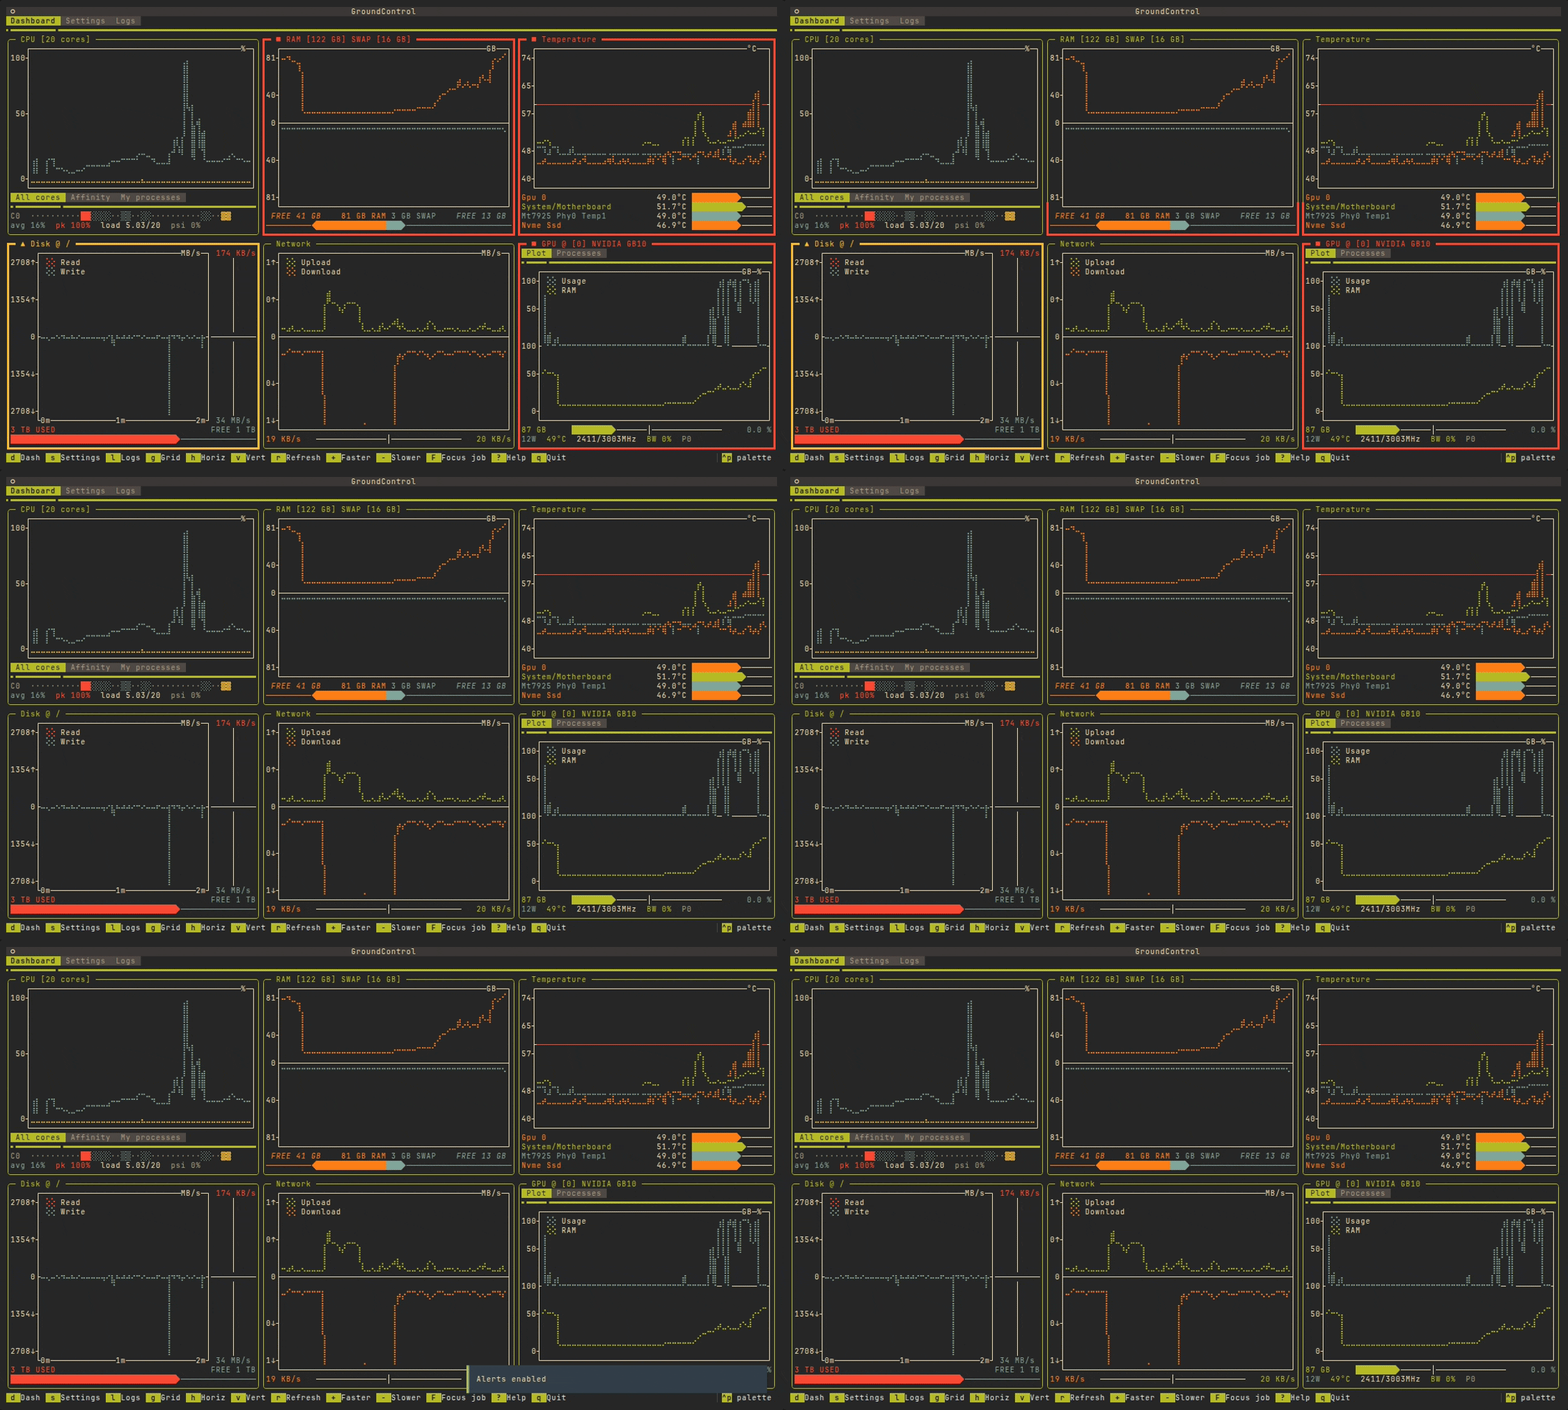
Any panel that crosses a threshold paints its border and prefixes its title with a marker — ▲ for a warning, ■ for critical. The marker matters as much as the colour: it survives a monochrome terminal, and it means you can tell the two states apart without relying on colour alone.
- Direction is a property of the metric, not of your config — "CPU above 90%" and "disk free below 2 GB" are both written as plain numbers.
- A breach stays visible for a few seconds after recovery, so a spike that happened while you were on another tab is not missed. An escalation still shows immediately.
- Sensible defaults ship for every metric. GPU utilization is off by default — a pegged GPU is usually the goal, not an incident — as are network rates, which have no site-independent ceiling.
- Press
ato toggle alerting at runtime;alerts_enabled,alert_sticky_secondsandthresholdspersist it.
🛠️ Configuring Ground Control
Ground Control offers extensive customization options to tailor your monitoring experience. You might not want to see all the widgets all at once, or you may want to focus on specific system metrics.
🔹 Settings Tab
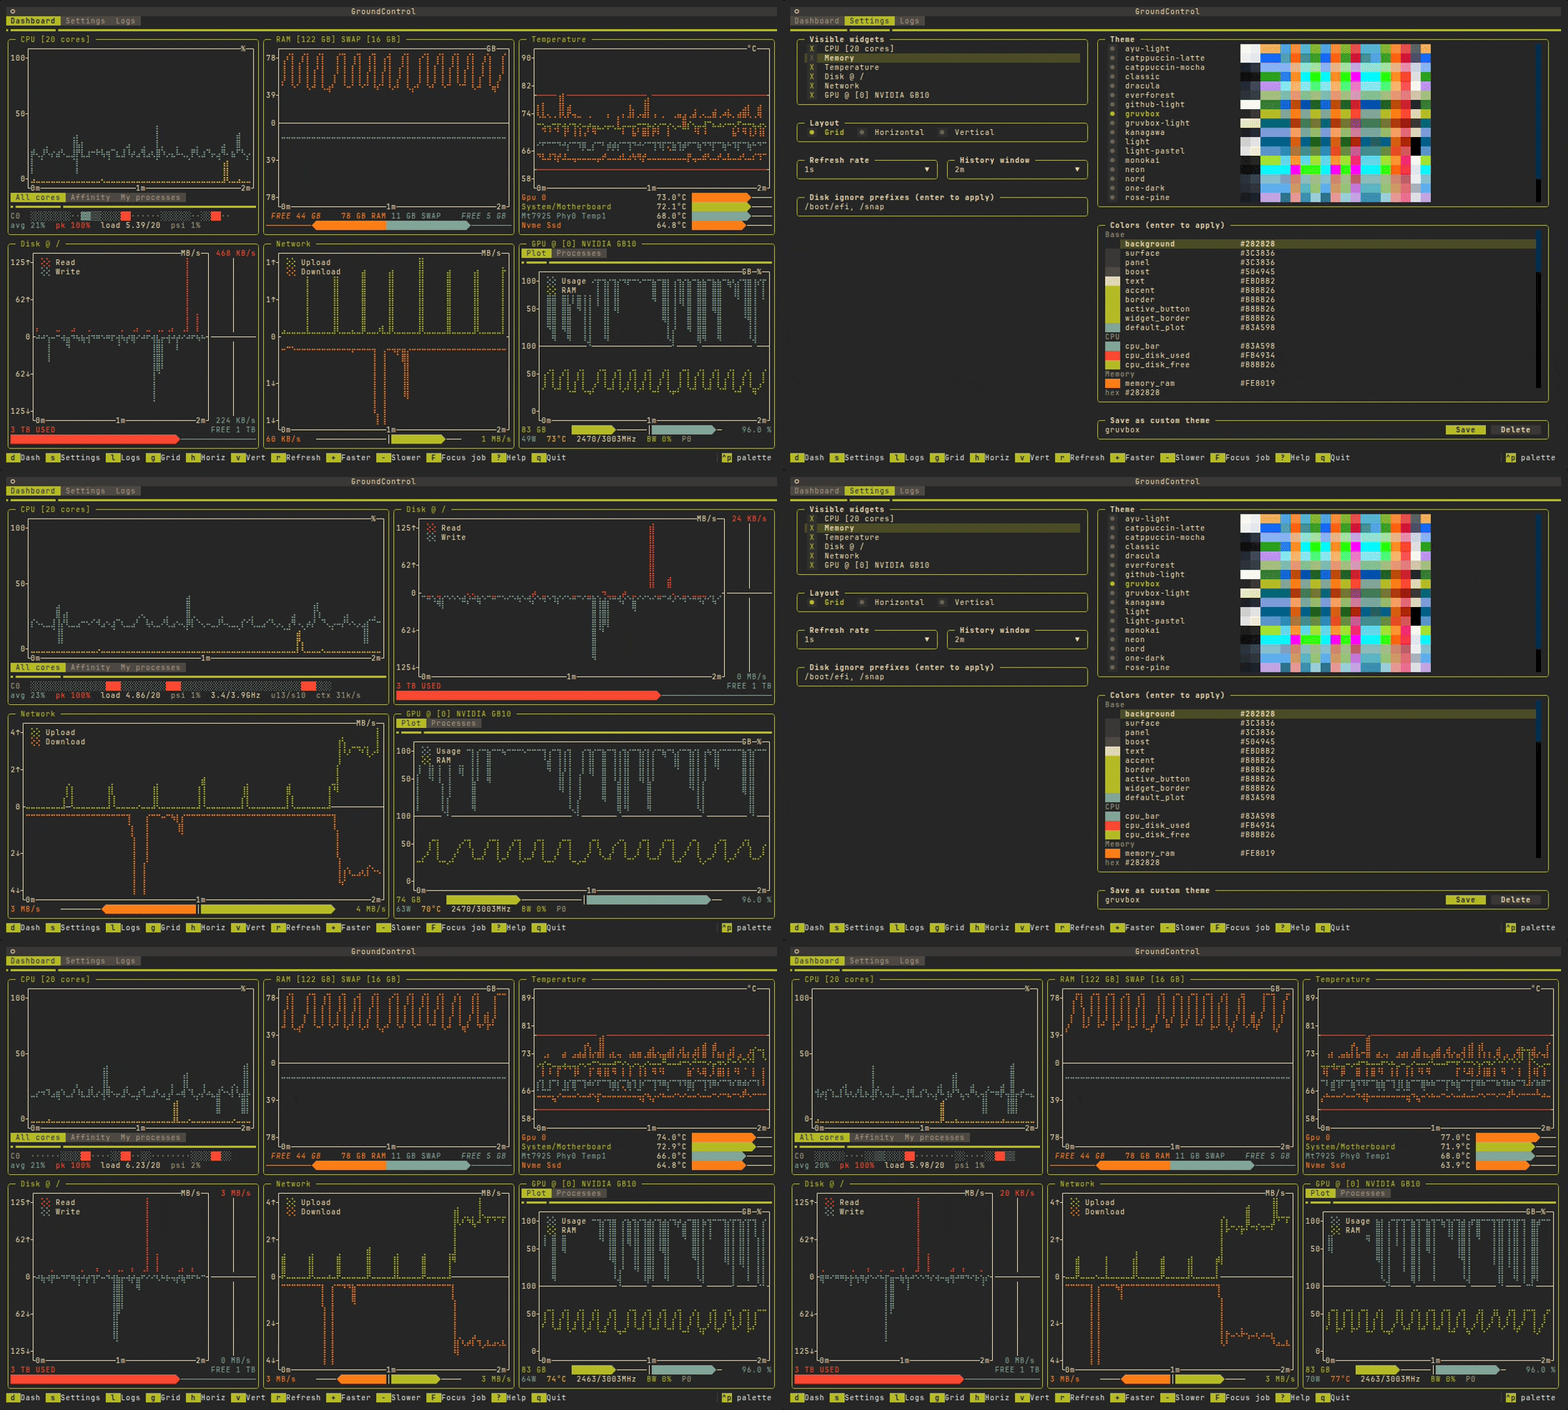
The settings panel can be accessed by pressing s or clicking the Settings tab. It lets you:
- Toggle widgets: Enable/disable individual widgets (CPU, Memory, Temperature, each Disk, Network, each GPU) by clicking their checkboxes
- Refresh rate: Choose update intervals from 500ms to 1 minute
- History window: Set the data history length from 30 seconds to 10 minutes
- Hide mounts: Keep uninteresting filesystems out of the dashboard with the disk ignore prefixes
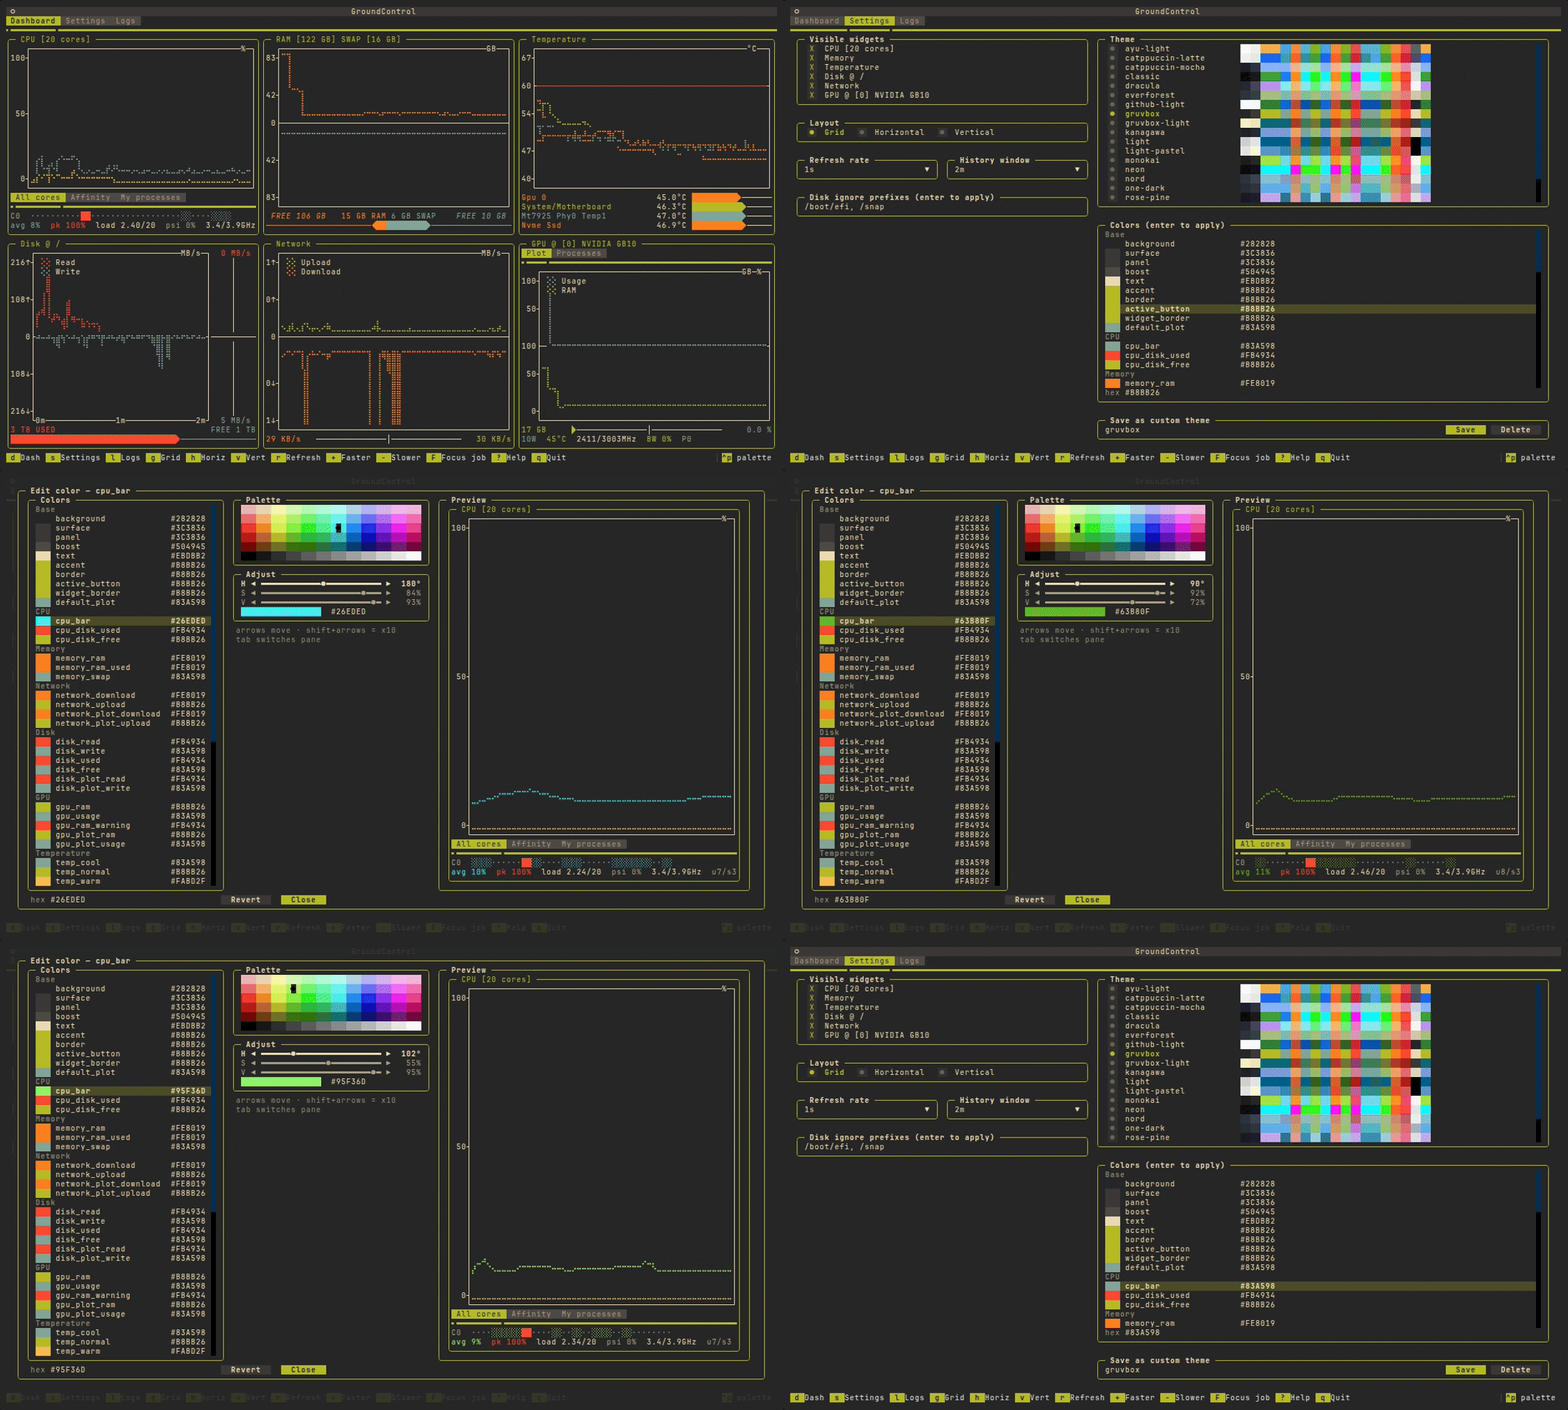
- Pick a theme: Choose one of the built-in palettes, edit any individual color, and save the result as your own theme
- Save preferences: All settings are automatically saved to
~/.config/ground-control/config.json
The config file stores:
- Widget visibility settings for each widget
- Current layout (grid/horizontal/vertical)
- Refresh rate in seconds
- History size in seconds
🔹 Layout Management
You can switch between different layouts instantly:
- Press
gor clickGrid Layoutfor the structured grid view - Press
hor clickHorizontal Layoutfor single-row alignment - Press
vor clickVertical Layoutfor column-based display
🔹 Themes
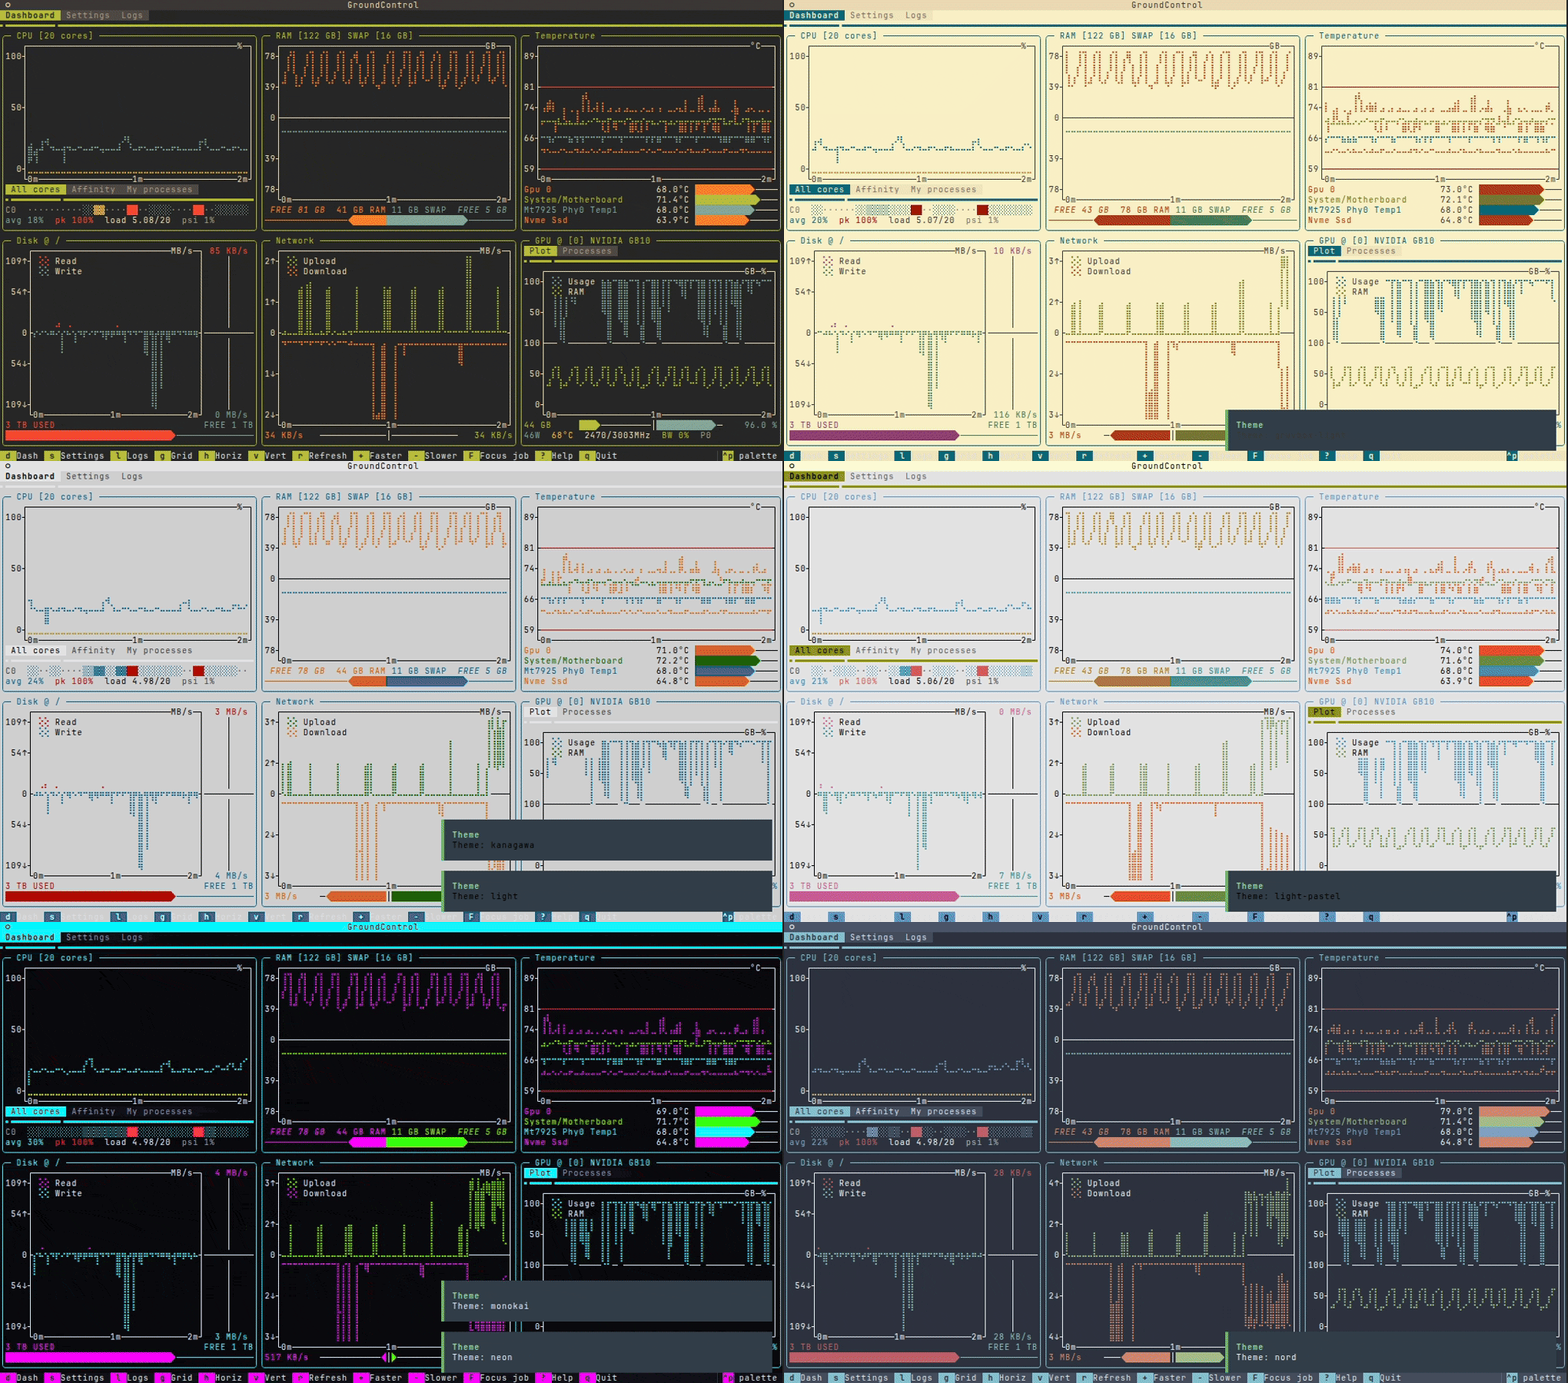
Twenty built-in palettes ship with Ground Control, dark and light. Pick one in the Settings tab, or press t to cycle through them without leaving the dashboard — plots, bars and borders all repaint live.
🔹 Editing Individual Colours
A theme is a starting point, not a straitjacket. The Settings tab lists every colour key grouped by widget; press enter on any of them to open the picker — a hue/shade swatch grid, plus H/S/V steppers for the shade the grid does not have (hold shift for ×10).
The preview pane on the right is a real metric widget being fed real data, not a mock-up, and every cursor move applies immediately, so you can see what a colour actually looks like on a live plot before you keep it. ctrl+z reverts to the value the key had when the screen opened.
Save the result as your own named theme from the Settings tab, or with gc theme --save-as NAME.
🔹 Persistent Configuration
All your customizations are automatically saved when you quit Ground Control. When you launch it again, you'll see the same layout and widget configuration you previously selected, ensuring a consistent monitoring experience.
🔹 Keyboard Shortcuts
All available keyboard shortcuts are listed here:
| Key | Action |
|---|---|
h |
Switch to Horizontal Layout |
v |
Switch to Vertical Layout |
g |
Switch to Grid Layout |
d |
Show the Dashboard |
s |
Show the Settings tab |
l |
Show the Logs tab |
t |
Cycle to the next colour theme |
r |
Refresh now |
+ / - |
Refresh faster / slower |
F |
Focus a Slurm job (arrow + enter) / return to this host |
? |
List every shortcut, including the ones not in the footer |
q |
Quit Ground Control |
The footer of the app always shows the keys available in the current context, and ? opens the full list.
Ground Control saves user preferences in a configuration file located at:
~/.config/ground-control/config.json.
Modify this file in your default text editor with
groundcontrol config
or
gc config
📟 Scripting and Health Checks
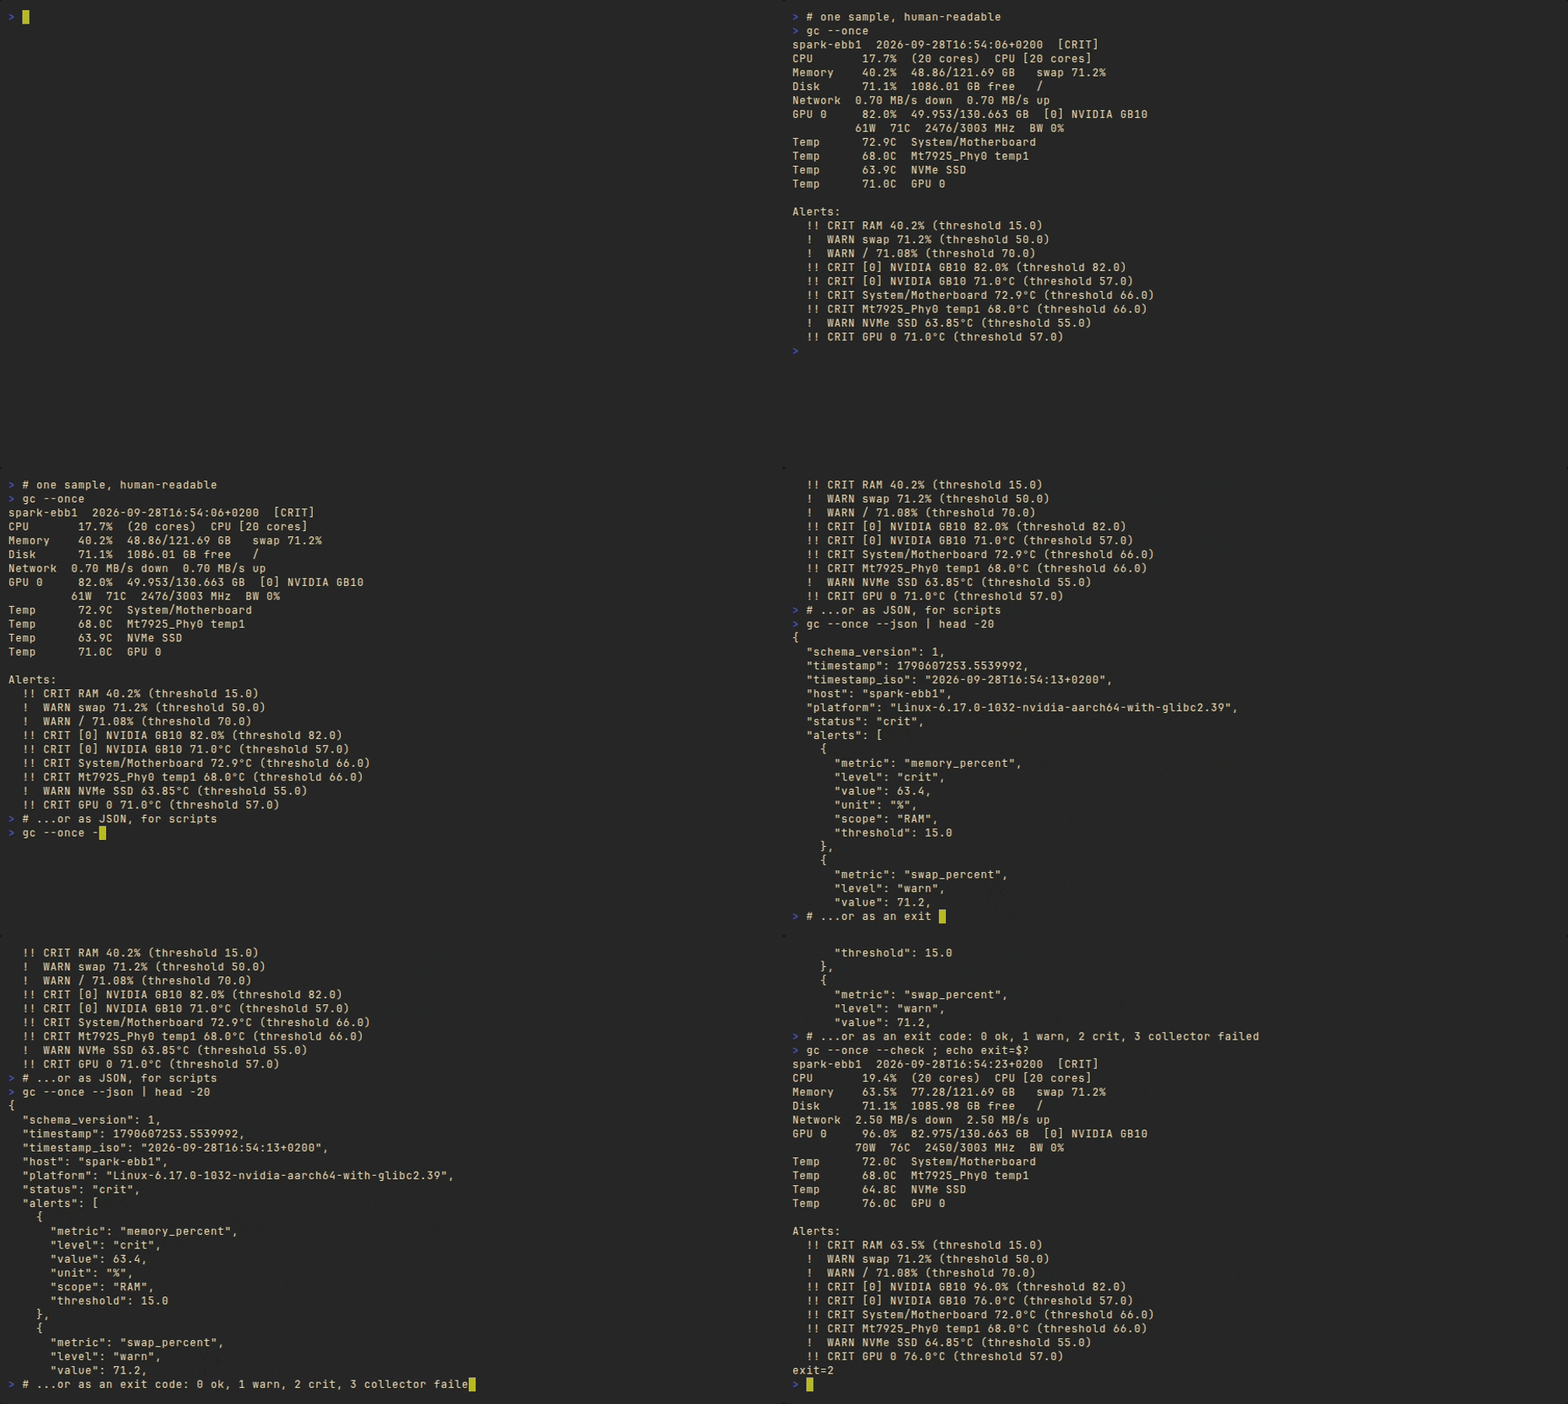
Ground Control is not only a TUI. gc --once takes a single sample, prints it and exits — no alternate screen, no event loop — which makes it usable from cron, CI, or a monitoring agent:
gc --once                      # one human-readable snapshot
gc --once --json               # ...the same sample as JSON, for scripts
gc --once --check              # ...as an exit code: 0 ok, 1 warn, 2 crit, 3 collector failed
--check follows the Nagios convention, so it drops into an existing monitoring setup unchanged. The JSON carries a schema_version and is built field by field, so internal metric changes cannot silently alter what your scripts parse.
Two details worth knowing: throughput figures are deltas, so --once primes the counters and samples again (--interval sets the gap), and the same mount filtering the dashboard uses applies here — without it every read-only squashfs under /snap reports as 100% full (--all-mounts opts back in).
For continuous collection, gc --stream emits one compact JSON object per line, flushed immediately, until stopped or --stream-max-seconds expires.
⛔ Current Known Limitations/Bugs
- In heavy-duty HPC systems, with multiple disks, cores and GPUs to be monitored, metric collection and plotting might get bottlenecked and groundcontrol might run slow. Consider directly editing the config file with a text editor to avoid
- GPU usage is monitored only for CUDA-enabled hardware. Ground Control detects MiG devices but in some cases it cannot detect their utilization. You'll see Usage UNAV in the GPU Widget if this is the case
- Temperature monitoring availability depends on system sensors and may not be available on all platforms
👨💻 Contributing
Pull requests and contributions are welcome! To contribute:
- Fork the repo.
- Create a feature branch.
- Submit a PR with your changes.
Visit the Issue Section to start!
Every animation in this README is generated from a vhs tape in demo/tapes/ — one tape per asset, all of them re-recordable with demo/record.sh. See demo/README.md if you change the UI and need to refresh them.
📜 License
This project is licensed under the GNU General Public License v3.0. See the LICENSE file for details.
📧 Author
Alberto Rota
📩 Email: alberto_rota@outlook.com
🐙 GitHub: @alberto-rota
1 maintainer

Metadata
1 maintainer
Release files for ground-control-tui 2.1.3
For a detailed explanation of source distributions (sdists) and built distributions (wheels), please see the package formats documentation.
Source distribution (sdist)
| File | Size | Uploaded | |
|---|---|---|---|
| ground_control_tui-2.1.3.tar.gz | 218.2 kB | Details |
Built distribution (wheel)
| File | Interpreter | ABI | Platform | Reset |
|---|---|---|---|---|
| ground_control_tui-2.1.3-py3-none-any.whl | Python 3 | none | any | Details |
Total release size: 422.4 kB
Release files / ground_control_tui-2.1.3.tar.gz
| Download URL | ground_control_tui-2.1.3.tar.gz |
|---|---|
| Size | 218.2 kB |
| Tags | Source |
|
SHA-256 checksum How to use checksums |
b2469c5b37905ce29e732aacf7e595bd4a63475d101feebf815e7cb733638ece
|
|
BLAKE2b-256 checksum How to use checksums |
8f916194621b9d6fcb992cd1aa4f5467dc2040f276fc0645c400944c51a9f575
|
| Upload date | |
|
Uploaded using Trusted Publishing? What is trusted publishing? |
No |
| Uploaded via |
uv/0.11.32 {"installer":{"name":"uv","version":"0.11.32","subcommand":["publish"]},"python":null,"implementation":{"name":null,"version":null},"distro":{"name":"Ubuntu","version":"24.04","id":"noble","libc":null},"system":{"name":null,"release":null},"cpu":null,"openssl_version":null,"setuptools_version":null,"rustc_version":null,"ci":null}
|
Release files / ground_control_tui-2.1.3-py3-none-any.whl
| Download URL | ground_control_tui-2.1.3-py3-none-any.whl |
|---|---|
| Size | 204.2 kB |
| Tags | Python 3 |
|
SHA-256 checksum How to use checksums |
0c70a3c80e236a1e8d778e0df2eb7c834578a53008aa7b5c3ae3e0637092dd37
|
|
BLAKE2b-256 checksum How to use checksums |
c7f688aff269f2e471351367661a8d887c792512568c9a709bc2bed779edbfbe
|
| Upload date | |
|
Uploaded using Trusted Publishing? What is trusted publishing? |
No |
| Uploaded via |
uv/0.11.32 {"installer":{"name":"uv","version":"0.11.32","subcommand":["publish"]},"python":null,"implementation":{"name":null,"version":null},"distro":{"name":"Ubuntu","version":"24.04","id":"noble","libc":null},"system":{"name":null,"release":null},"cpu":null,"openssl_version":null,"setuptools_version":null,"rustc_version":null,"ci":null}
|














