
🚀 Ground Control


A . gc draws CPU, memory, disks, network, temperatures and NVIDIA GPUs in one TUI, and on a Slurm cluster it can step into a job and show you that machine instead. Built with Textual, Plotext and nvitop.

I use it inside tmux, and I have run it in Windows Terminal, Tabby and the VS Code terminal. A monospaced font helps.
Contents
gcfeatures- Installation
- Quickstart
- The panels
- Layouts
- Slurm jobs
- Alerts
- Themes and colours
- Settings
- Scripting and health checks
- MCP for AI clients
- Keyboard
- Where things are saved
- CLI reference
- Known limits
- Contributing
- License
gc features
The usual metrics
CPU, RAM and swap, every mounted disk, network, temperatures, and one panel per NVIDIA GPU. Hide whatever you do not want, from Settings or from the command line.
Grid, row, or column
Three layouts. Drag the border between two panels, or nudge the focused one with ctrl and the arrows. z puts the sizes back.
Point it at a Slurm job
If squeue is installed, your jobs show up as their own panel. F on a running one starts a collector inside that allocation, so the plots are the compute node's. Focus ends on its own when the job does.
Print once and leave
gc --once prints one sample and quits. --json is for a script, --check is a Nagios-style exit code, and --stream keeps writing one JSON object per line.
Installation
groundcontrol ships as a Python package. We suggest installing it as a uv tool.
uv tool install ground-control-tui
Quickstart
gc
groundcontrol is the same command. The first launch is the grid: every panel this machine has, on screen at once.
Name the panels you want and you get only those. Leave them off and you get everything.
gc --cpu --ram --net          # -c -r -n
gc -g --gpu-index 0,1         # just these GPUs
gc --all-gpus                 # ignore CUDA_VISIBLE_DEVICES and the Slurm allocation
gc --slurm                    # only the jobs panel; --squeue is the same flag
gc --debug                    # let exceptions through instead of swallowing them
The panels
CPU
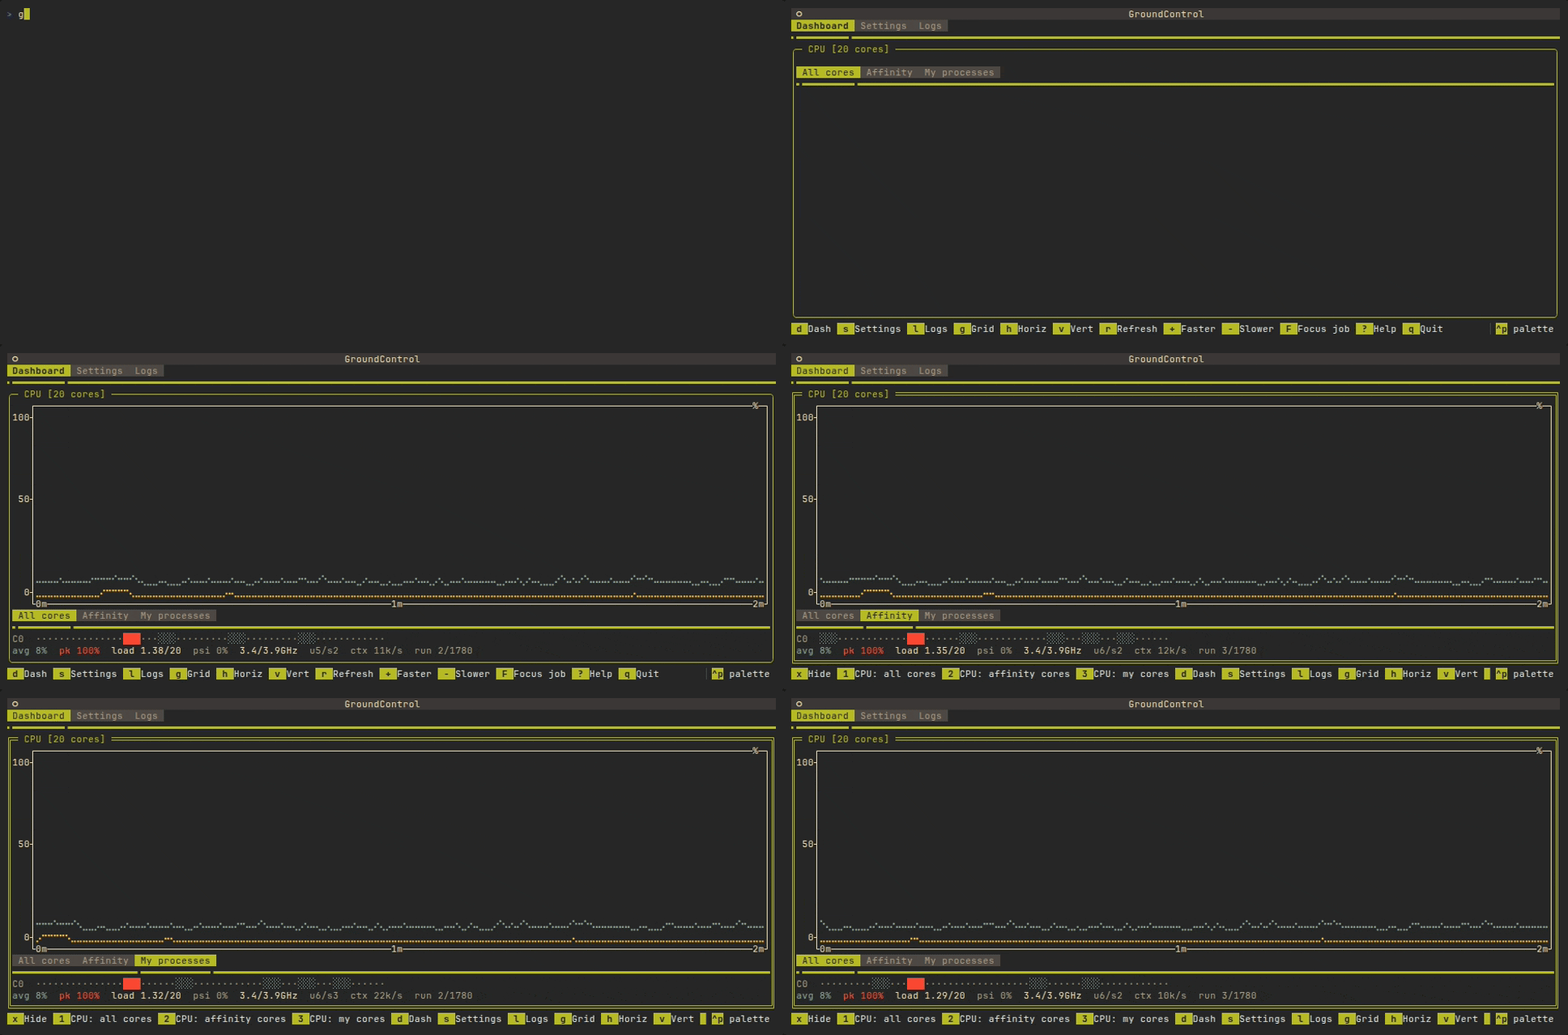
Per-core bars, plus a heatmap when the machine has a lot of cores. With the panel focused, 1 is every core, 2 is the cores this process is affined to, 3 is the cores your user is actually on.
Memory
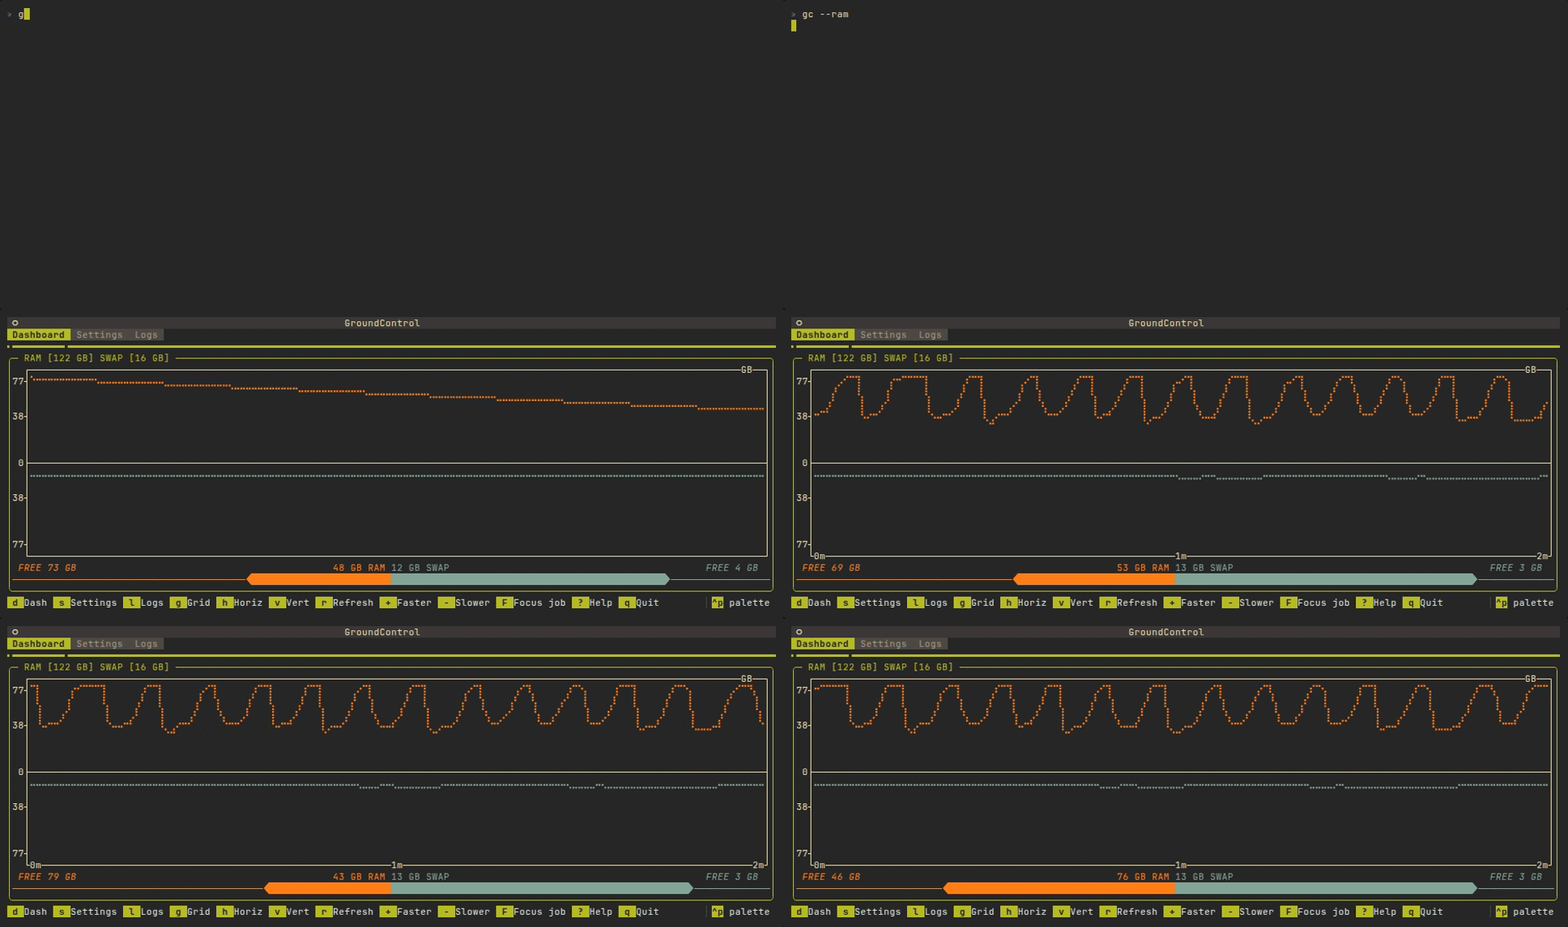
RAM grows up from the centre, swap grows down. The bar under the plot is used and free for both, and the title carries the totals.
Temperature
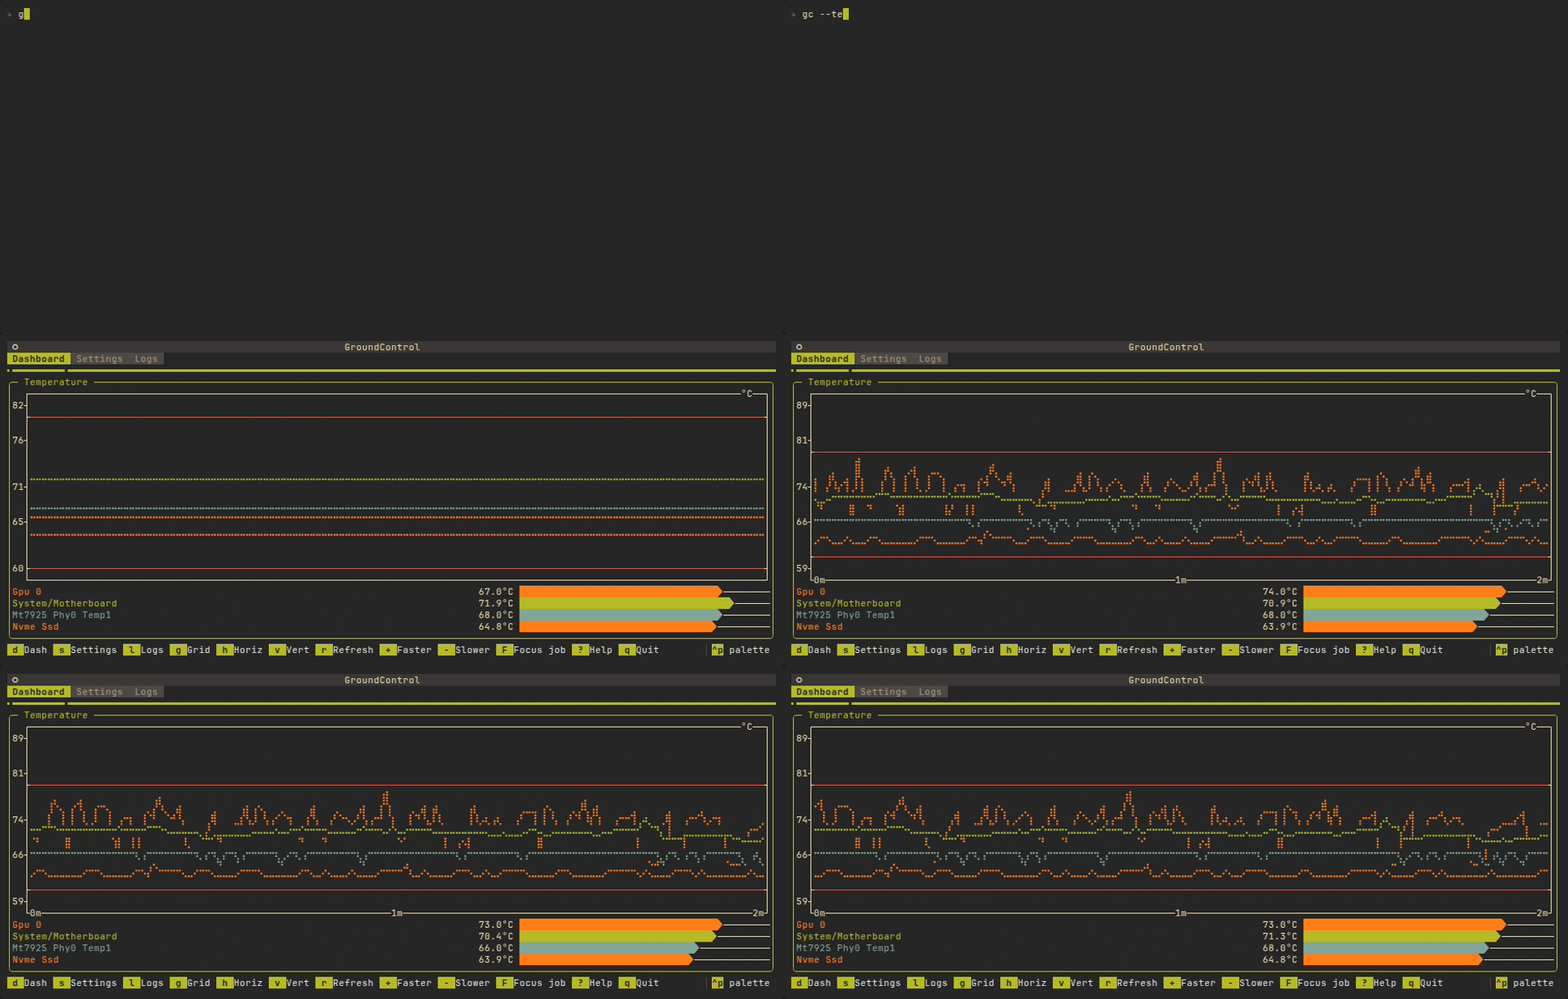
A few sensors over time, CPU, GPU and the board first. The bars on the right are the reading right now.
Disk
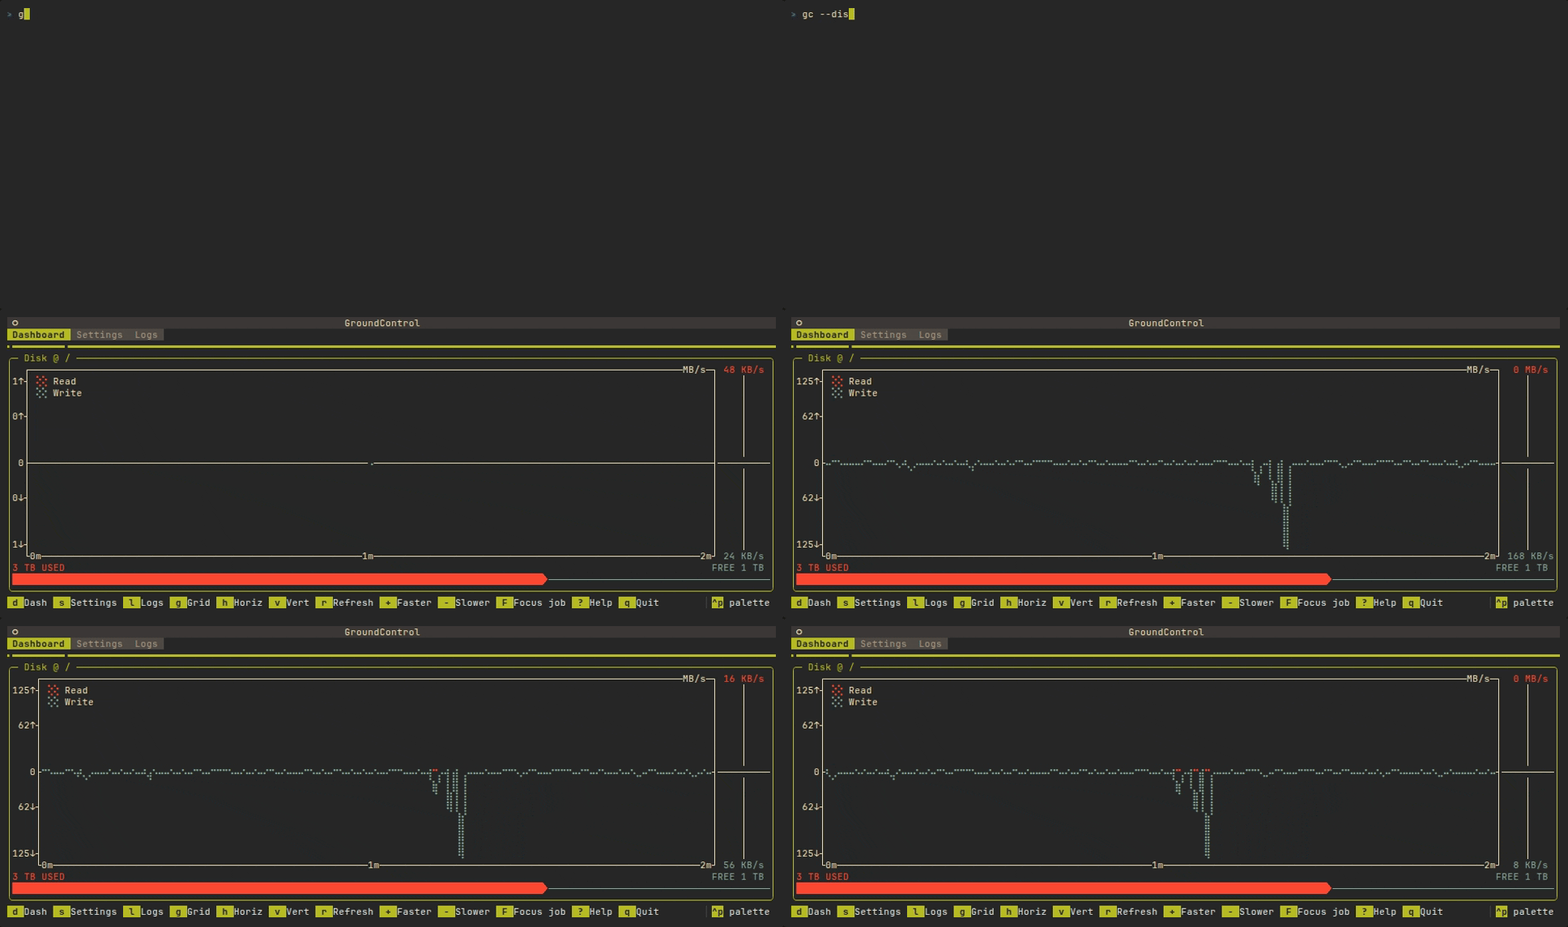
One panel per mount. Read grows up, write grows down, and the bar is used and free space. /boot/efi and /snap are skipped; the ignore list is in Settings, and gc --once --all-mounts puts them back for a snapshot.
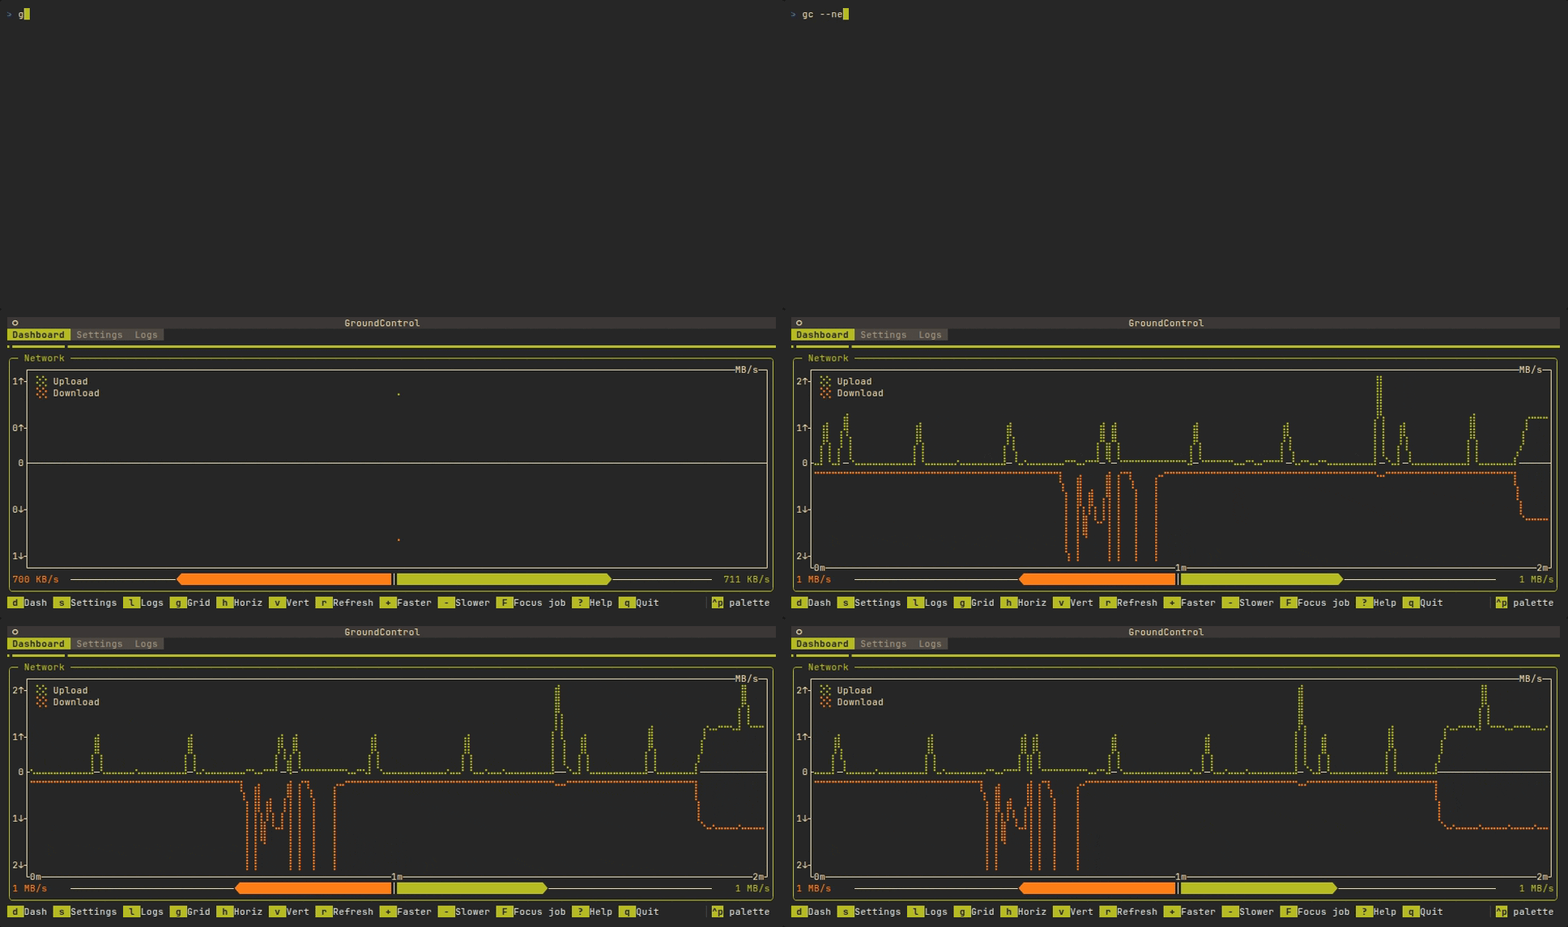
Network
Upload up, download down, with the running totals beside the current rate. Under the bar, one line: the main interface and its address, how many ports are listening (how many on more than loopback, how many are yours), open connections, and the TCP retransmit rate. Retransmits lead the line, marked, once they pass 2%: a lossy link stalls transfers in a way no throughput plot explains.
2 lists the interfaces (InfiniBand flagged, link state, address, speed, per-interface rates). 3 lists the listening ports: who bound them, the process when it is yours (without root other users' sockets show no pid), and a guess at the service from the port (jupyter, tensorboard, ray dashboard…). A socket bound to every interface is marked any ▲; loopback-only ones are dimmed. In job focus these are the compute node's, which is how to find the port your notebook picked.
GPU
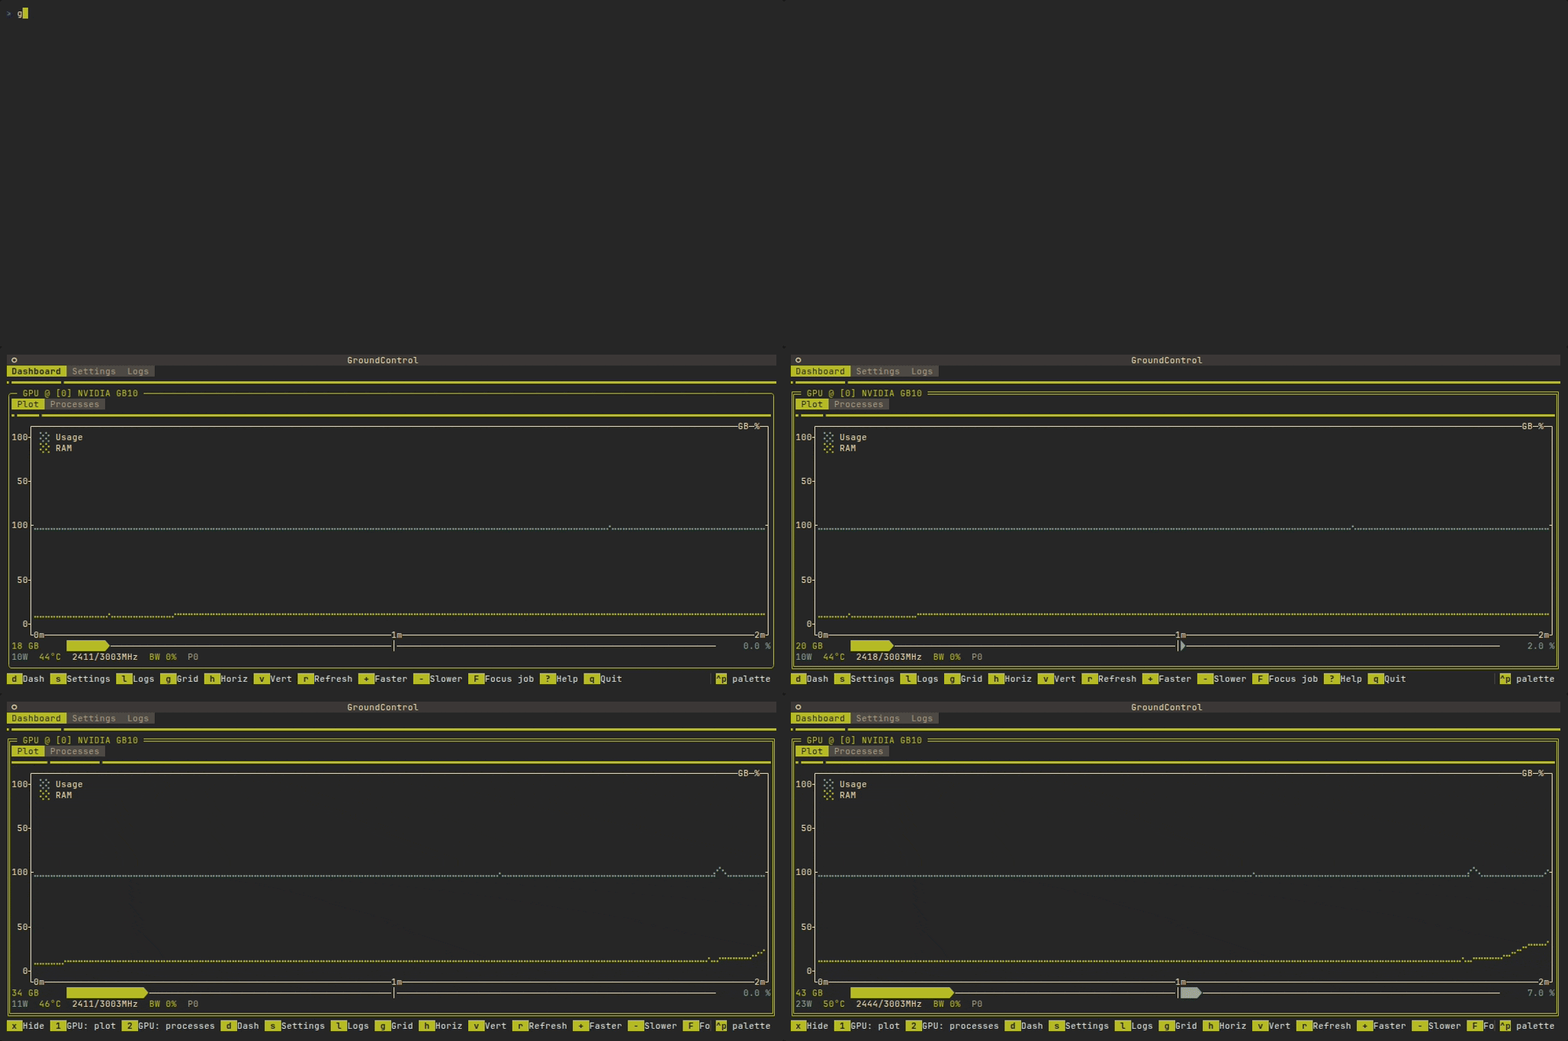
NVIDIA only, one panel per card. Utilization up, memory down. Under the bar is a telemetry line: power against its limit, temperature, SM clock, memory-bandwidth utilization, and a clock-throttle reason when NVML reports one. A card at 100% utilization drawing a small fraction of its power cap, with the memory bus idle, is waiting on data.
1 (or p) is the plot, 2 is the process list. K, T and I send SIGKILL, SIGTERM and SIGINT to that pid. MiG devices show up, and when utilization cannot be read the panel says Usage UNAV.
The ○ at the start of a process row selects it for the plot. With any process selected, the plot and bar show only those processes: their summed GPU memory and SM utilization, as NVML samples it per process, history included. The panel's bottom edge says how many are selected; c goes back to the whole card. A selected process that exits stays plotted until its samples scroll out of the window.
On a shared node gc shows only the GPUs your job holds. It reads CUDA_VISIBLE_DEVICES and Slurm's SLURM_STEP_GPUS / SLURM_JOB_GPUS, and checks them against what NVML can see. That check covers nodes where every card is visible but the job holds one, which happens when Slurm does not fence devices, and when CUDA_VISIBLE_DEVICES is numbered relative to the job. If nothing is set but the session belongs to a job (an ssh session adopted into it, say), scontrol show job -d names the cards. gc --once --json and the MCP tools report the decision as gpu_scope; --all-gpus turns it off.
Layouts
g is the grid, h is one row, v is one column, b is the bento. space cycles them. A wide tmux pane wants h; a tall one wants v.
In the bento, panels come in different sizes. Focus one and shift+right / shift+left make it span more or fewer columns, and shift+down / shift+up more or fewer rows. > and < change how many columns the bento has (1 to 8; 4 to start). Panels are packed in order, each into the first place it fits, so m or dragging one panel onto another rearranges it. A gap that nothing fits into goes to the panel beside it. It starts with the CPU and Slurm panels two columns wide and each GPU two by two. z puts the spans back to that as well as resetting the track sizes.
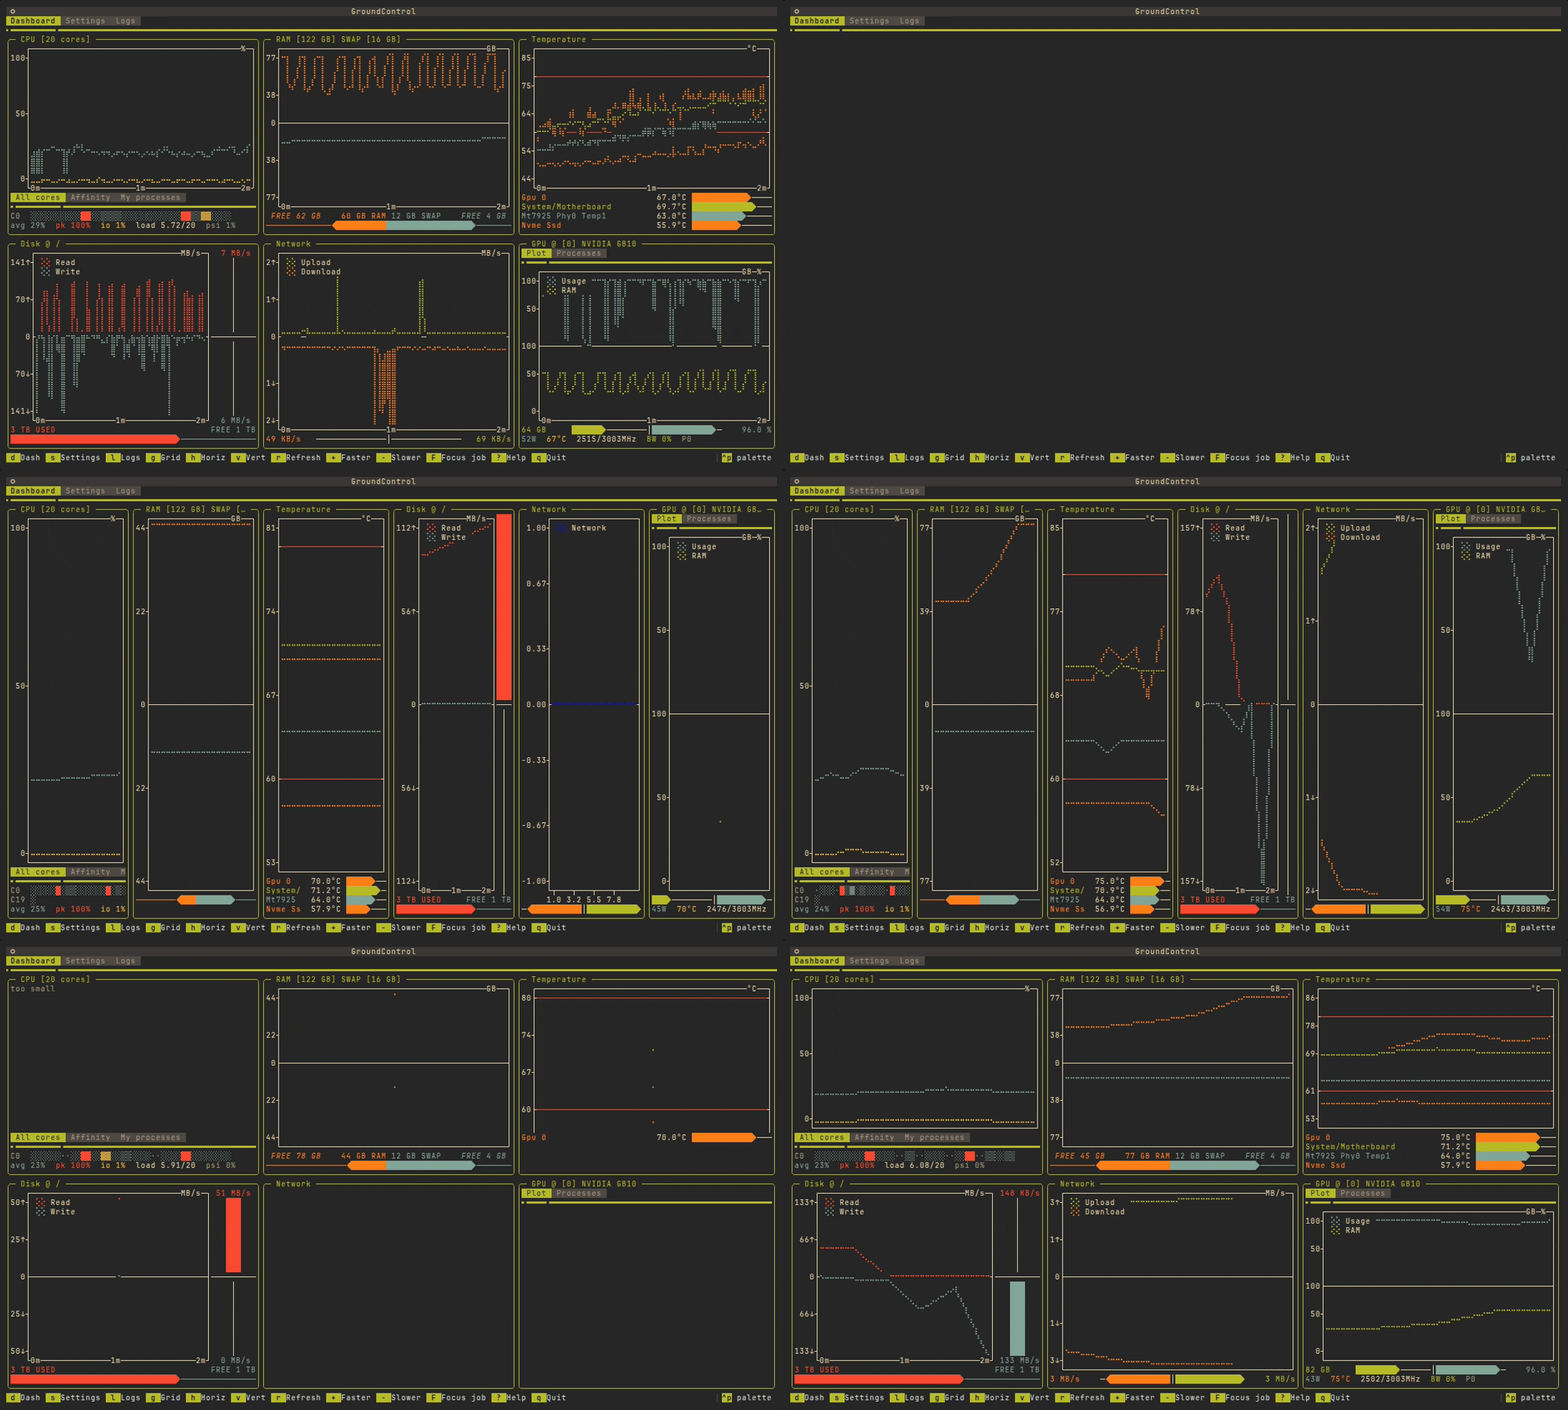
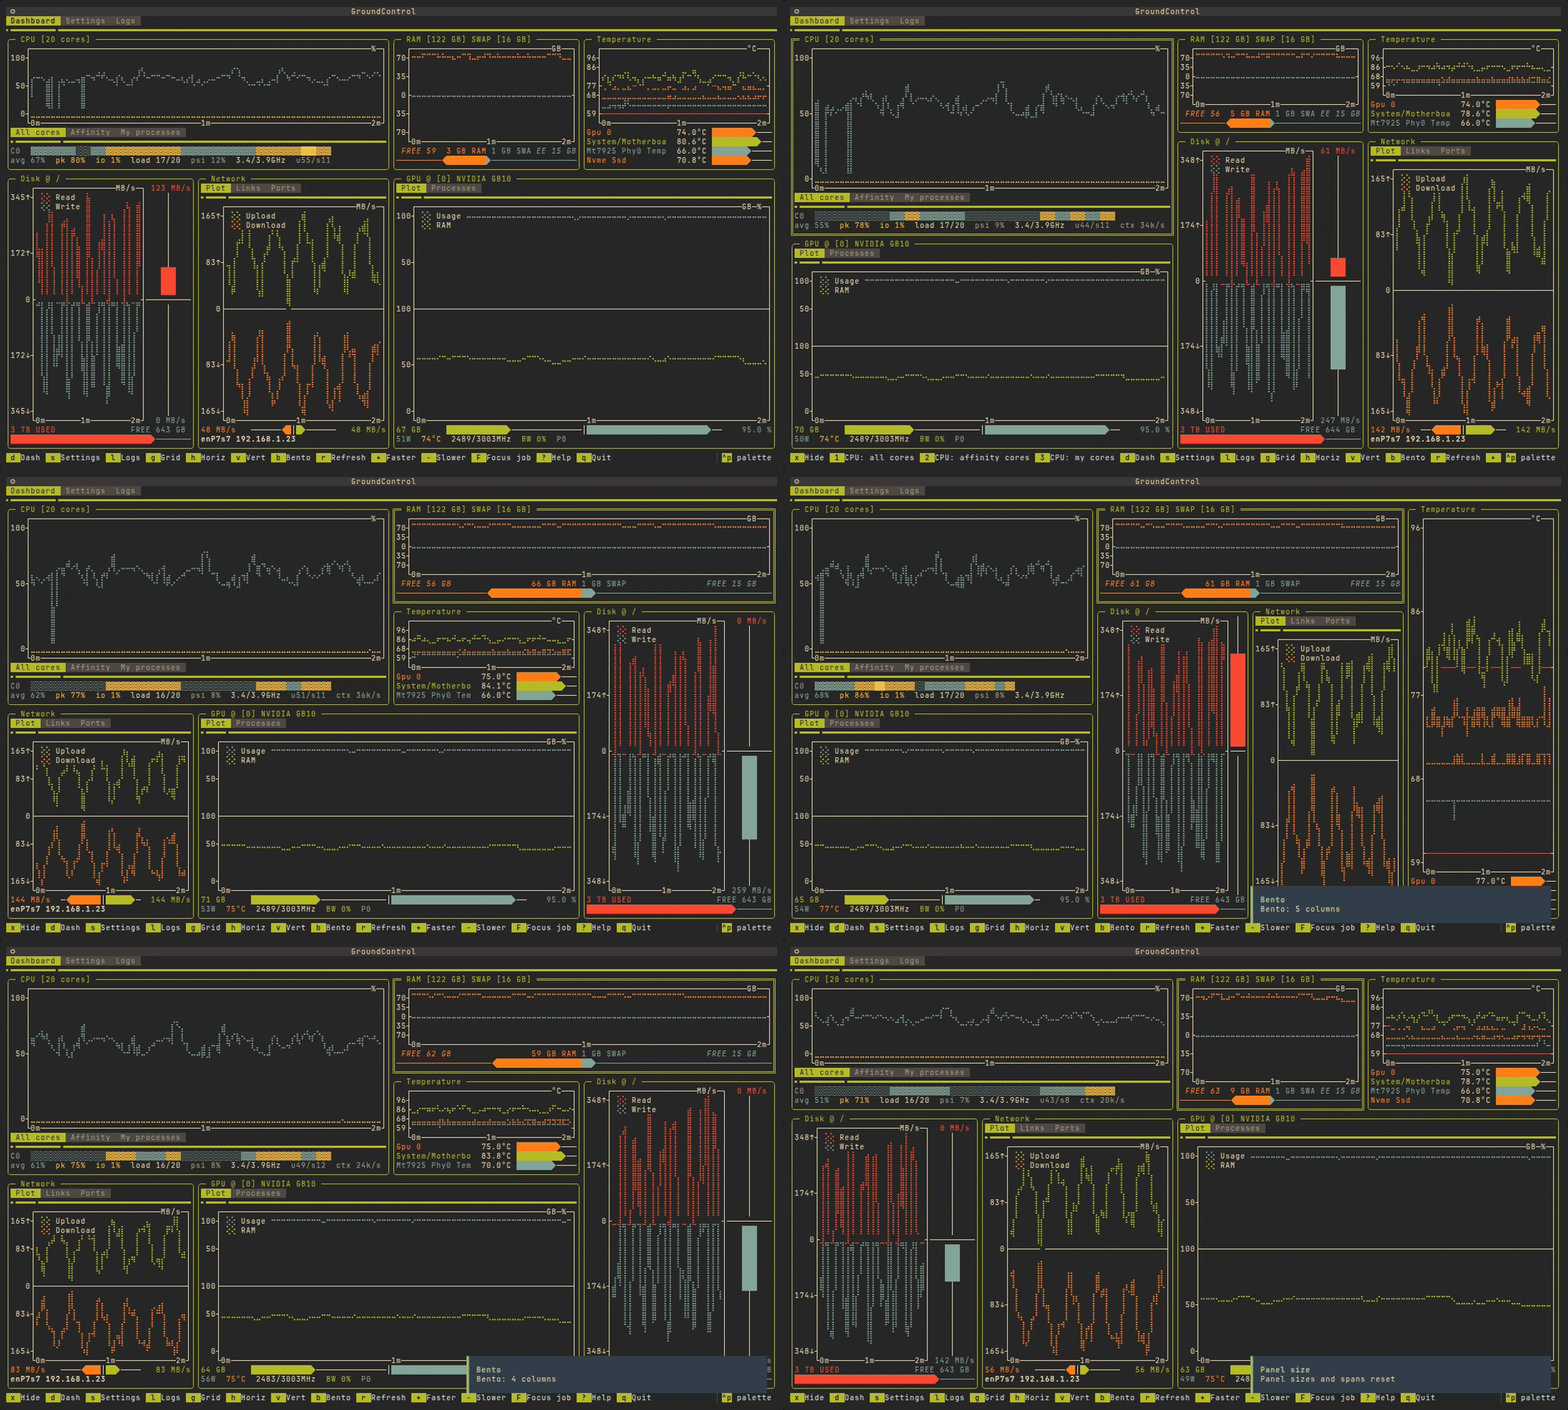
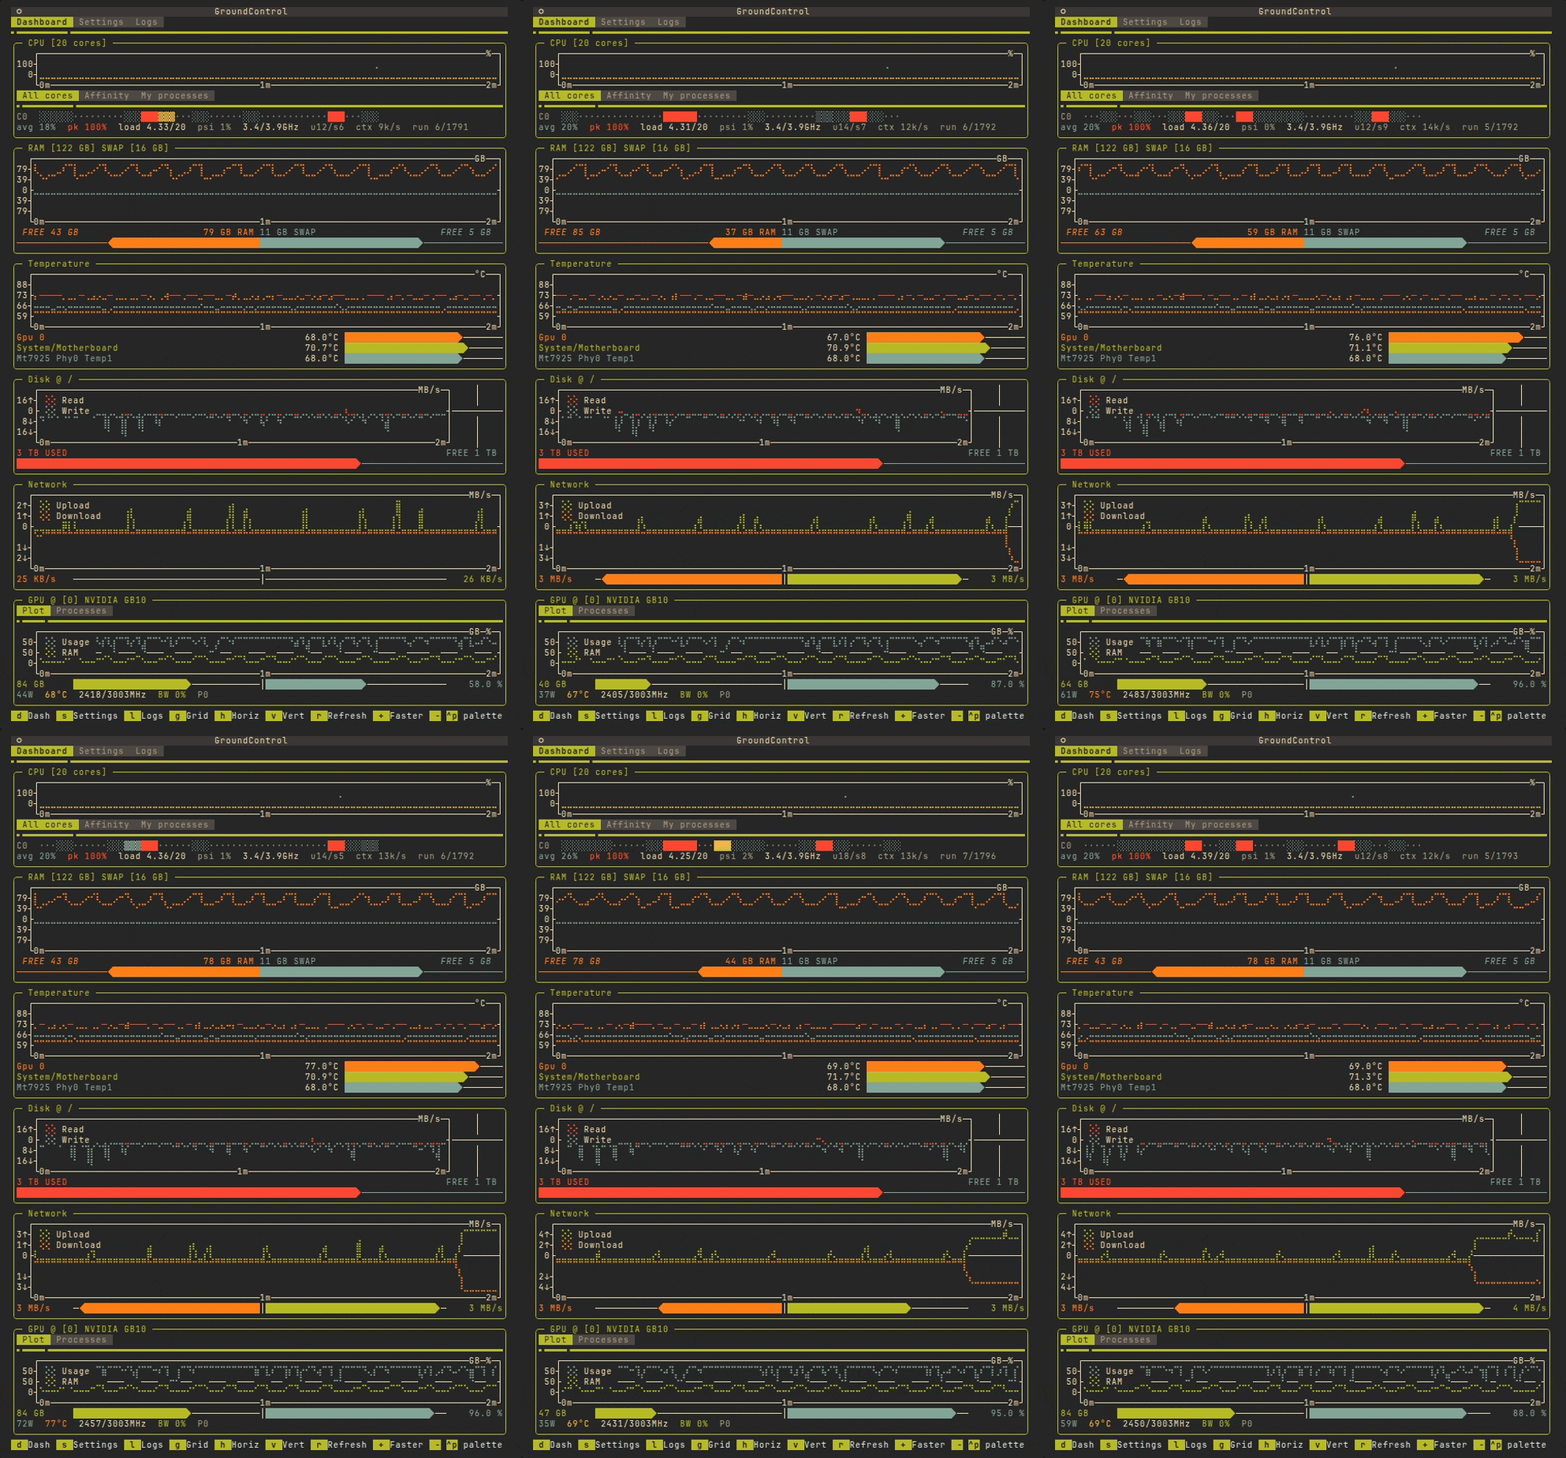
Two panels that share a grid row share its height. That is how the grid works. ctrl+left / ctrl+right and ctrl+up / ctrl+down change the focused panel's column or row, and the other tracks take up the rest. Dragging the border between two panels moves only that pair. z resets. m marks the focused panel and a second m on another one swaps them (esc backs out). x hides the focused panel; turn it back on from Settings.
The sizes are remembered per layout, so a grid you spent time on is still there after you visit the single-row view and come back.
Slurm jobs
The panel is there on its own when squeue is on PATH. gc --slurm shows only that panel, the same way gc --cpu shows only the CPU.
Every job you have queued is one row: id, state, time, node, CPUs, memory, GPUs, partition, name. A narrow panel drops columns from the least useful end. A second line on each row is the time-limit gauge (how close the job is to being killed) and, for a running job, what sstat says it is using.
Three buttons on the row:
Ffocuses it.gcstartssrun --overlap --jobid=Nand runs a collector inside the allocation, so CPU, memory, GPU and process readings are the compute node's. The panel title shows the job and the node, and(starting…)or(stale Ns)when the sample is not live yet. Focus ends when the job leavesRUNNING, and the toast names the final state when Slurm has one (COMPLETED,FAILED,TIMEOUT,CANCELLED).Oopens the log.scontrolnames the stdout and stderr paths andgcreads them locally, which is the usual shared filesystem. You get the last 64 KB, ANSI is rendered, and follow mode leaves you alone if you have scrolled up. An interactive job with no output file says so.Ccancels it. The first press arms the button (it turns red), the second press within four seconds runsscancel. It disarms on its own.
F from anywhere opens the list of your running jobs. Arrow to one, enter focuses it, u stops focusing and you are back on this host. A queued job is still in the panel, and it is still the cheap moment to cancel one. It is absent from the picker because it holds nothing to sample yet.
Alerts
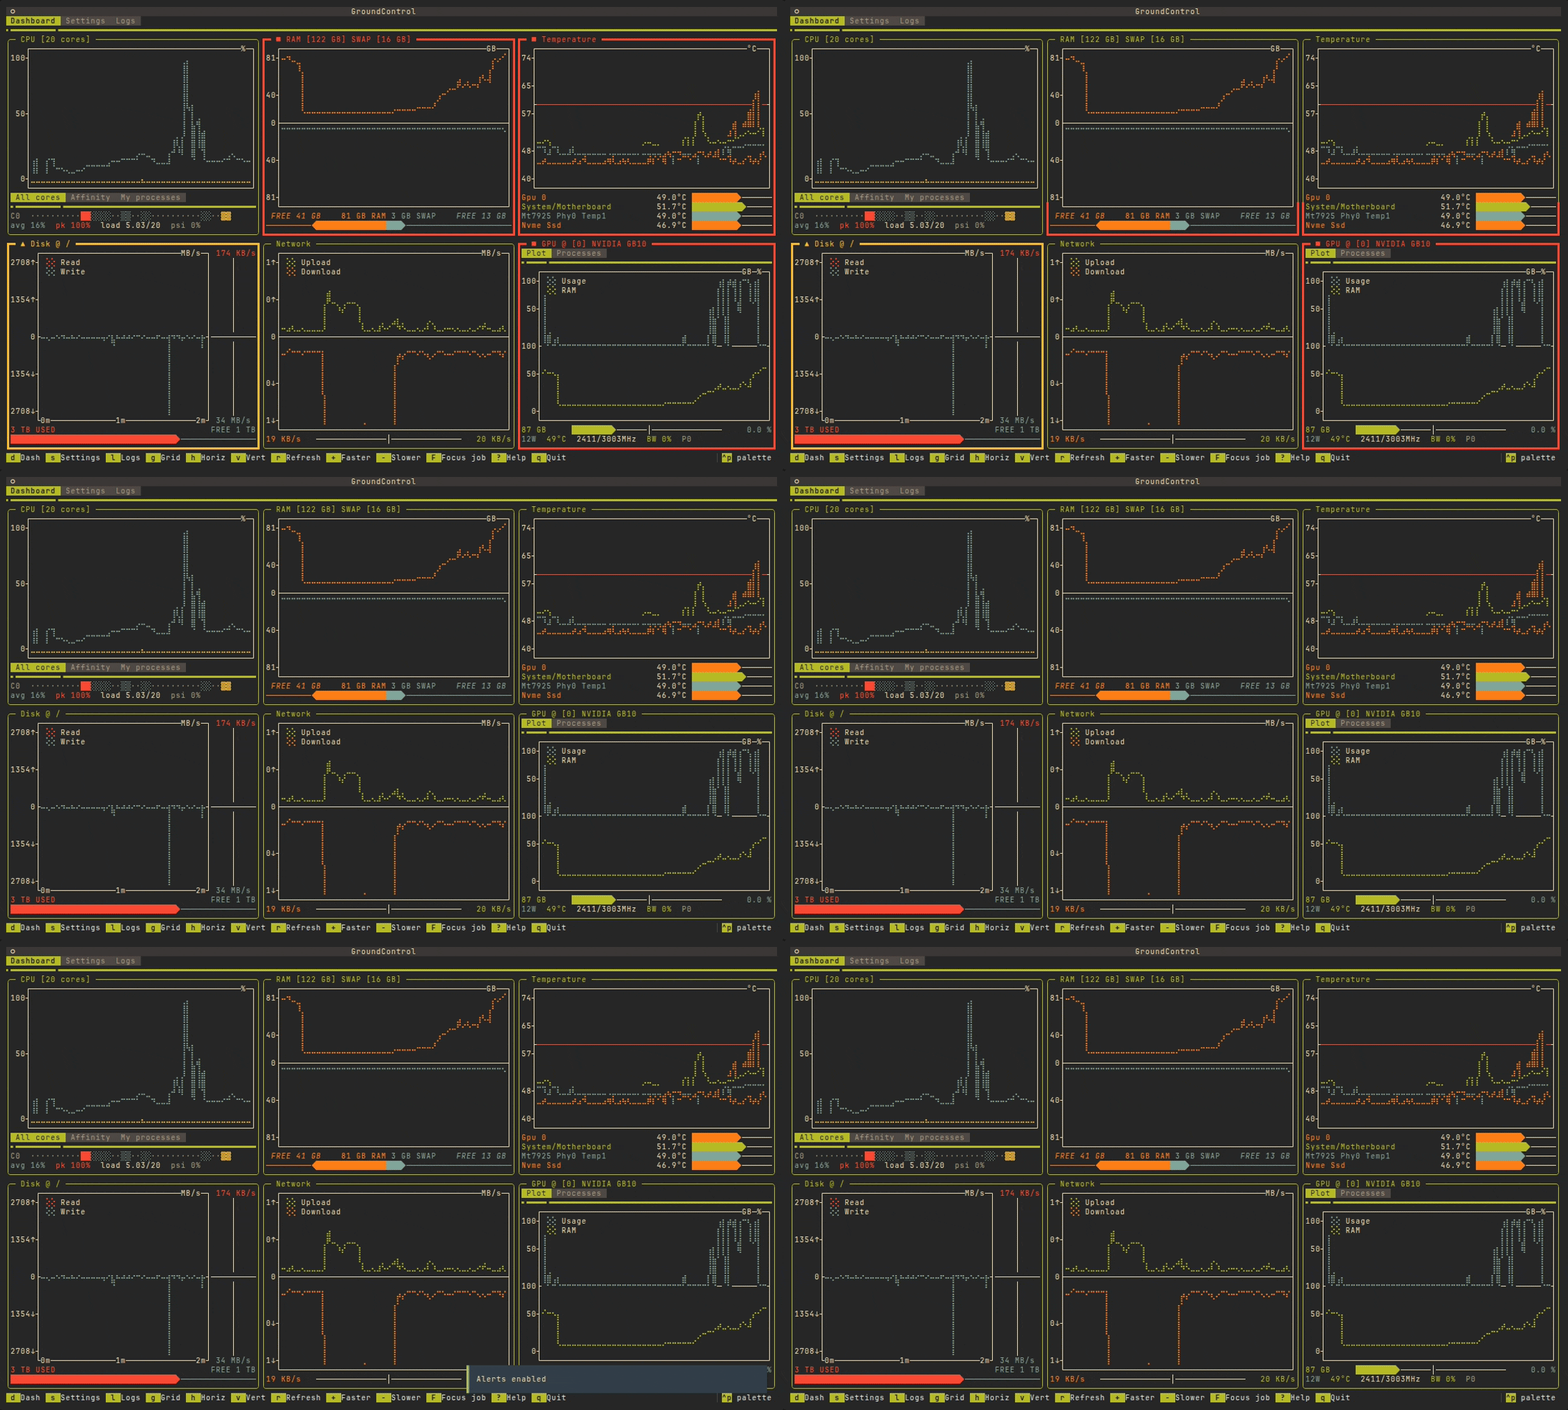
A panel that crosses a threshold paints its border and prefixes the title: ▲ for a warning, ■ for critical. The marker is what you can still read on a monochrome terminal.
You only write the number. Whether a high value or a low one is the bad direction is fixed per metric, so "CPU over 90%" and "less than 2 GB free" are both plain numbers in the config. A breach stays visible for a while after it recovers (alert_sticky_seconds, 30 seconds unless you change it), so a spike that happened on another tab is still marked when you come back. A warning that becomes critical shows immediately.
GPU utilization ships disabled. A pegged GPU is usually the job. Network rates ship disabled too, because a useful ceiling depends on the link. a toggles the whole thing at runtime. alerts_enabled, alert_sticky_seconds and thresholds live in the config file.
Themes and colours
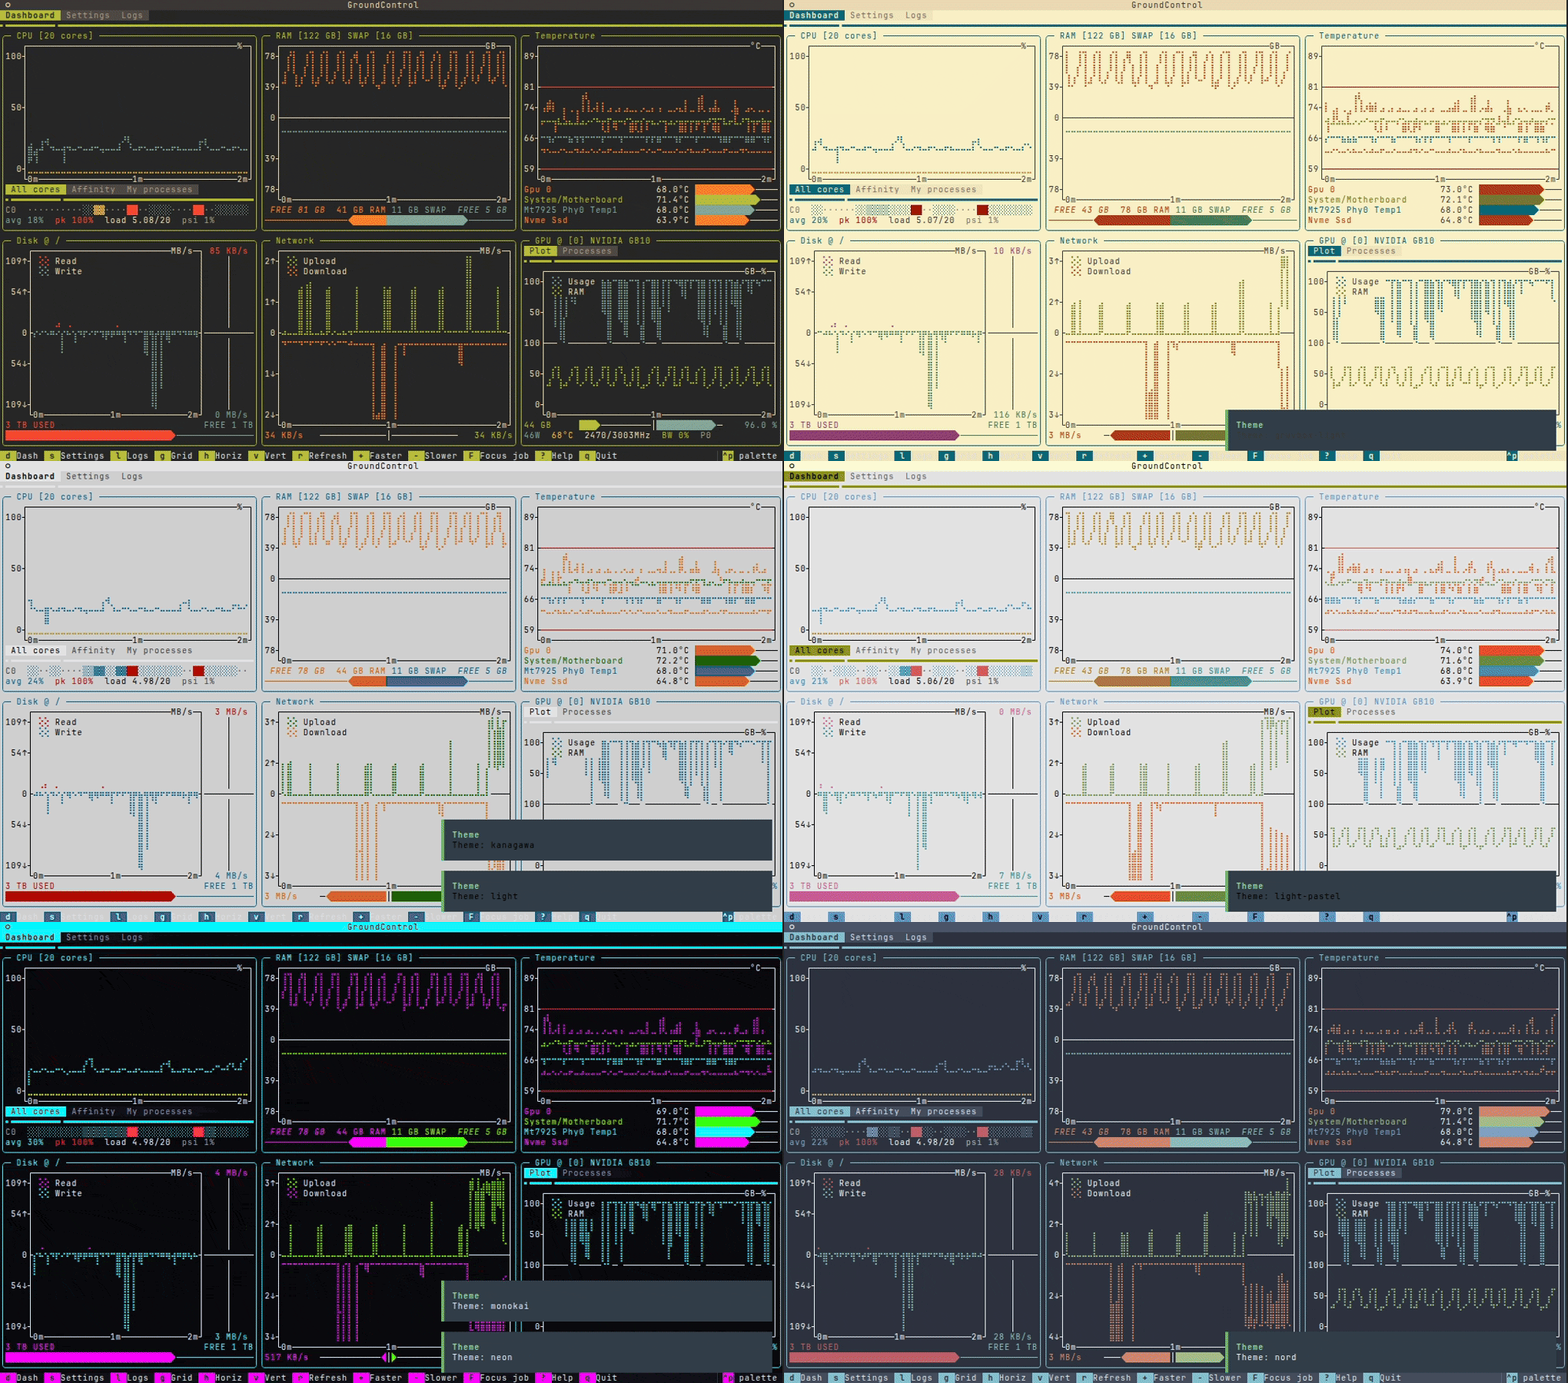
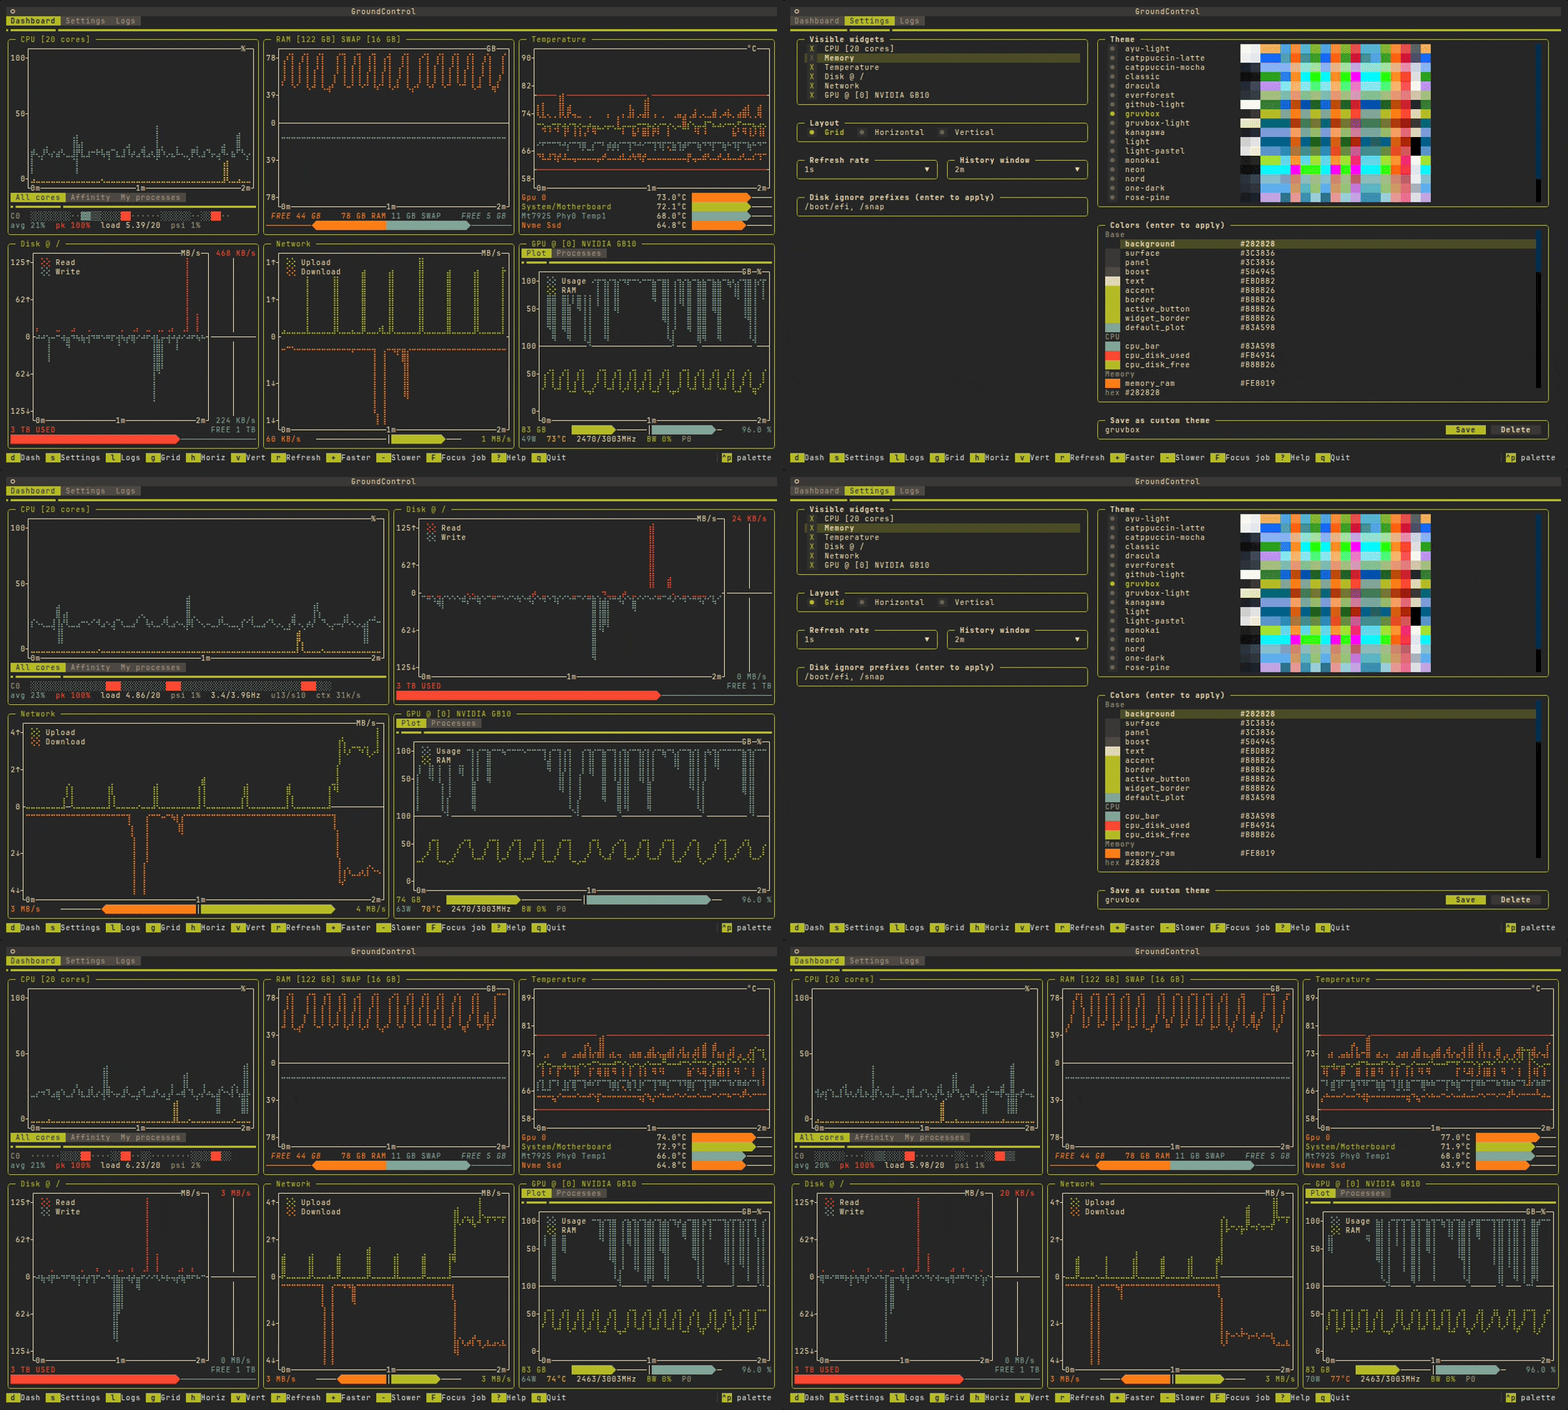
Twenty palettes ship with the package, dark and light. t cycles them without leaving the dashboard. Plots, bars and borders repaint on the next tick.
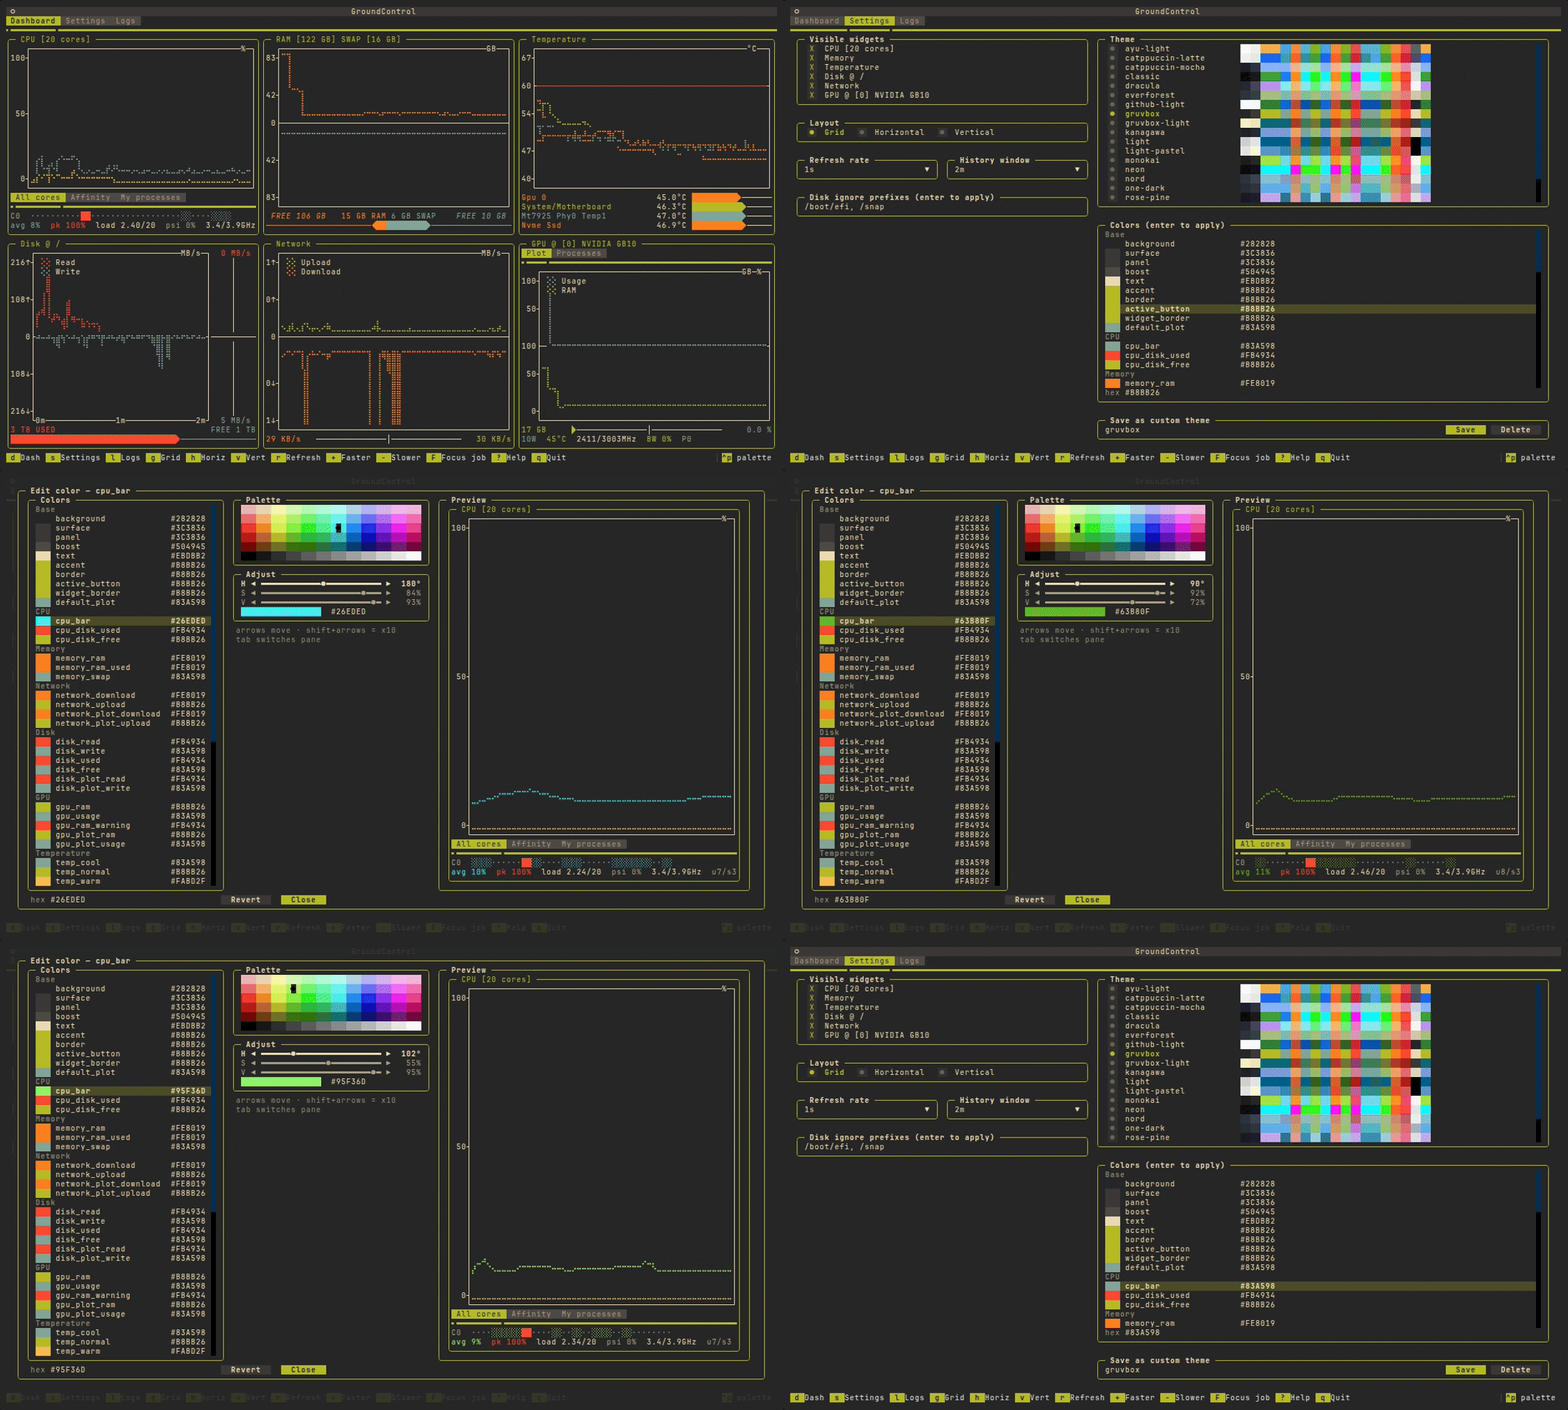
The same list is in Settings. Enter on a colour row opens the picker: a hue and shade grid, and H/S/V steppers for the shade the grid does not have (hold shift for ten steps). The preview on the right is a real metric widget on the latest sample, and the colour applies as you move, so you see it on a live plot before you keep it. ctrl+z puts that key back to the value it had when you opened the screen.
Save the result as a named theme from Settings, or from the shell. Your themes live in ~/.config/ground-control/themes/ and shadow a builtin of the same name. Applying one from the CLI takes a restart; editing a colour inside the app does not.
gc theme --list
gc theme --monokai          # or: gc theme monokai
gc theme --save-as my-theme
gc theme --delete my-theme
Settings
s opens Settings, d goes back to the dashboard, l is the log.
From there you turn panels on and off, pick the layout, set the refresh rate (500 ms up to a minute) and how much history to keep (30 seconds up to 10 minutes), edit the disk ignore prefixes, pick a theme and edit single colours. Quitting writes ~/.config/ground-control/config.json, and the next launch comes back the same way.
Open that file in $EDITOR (nano if EDITOR is unset):
gc config            # groundcontrol config
gc config --path
gc config --reset
Scripting and health checks
gc --once takes one sample, prints it, and exits. No alternate screen, so cron and CI can call it.
gc --once                 # a readable snapshot
gc --once --json          # the same sample as JSON
gc --once --check         # 0 ok, 1 warning, 2 critical, 3 the collector failed
gc --stream               # one JSON object per line, until you stop it
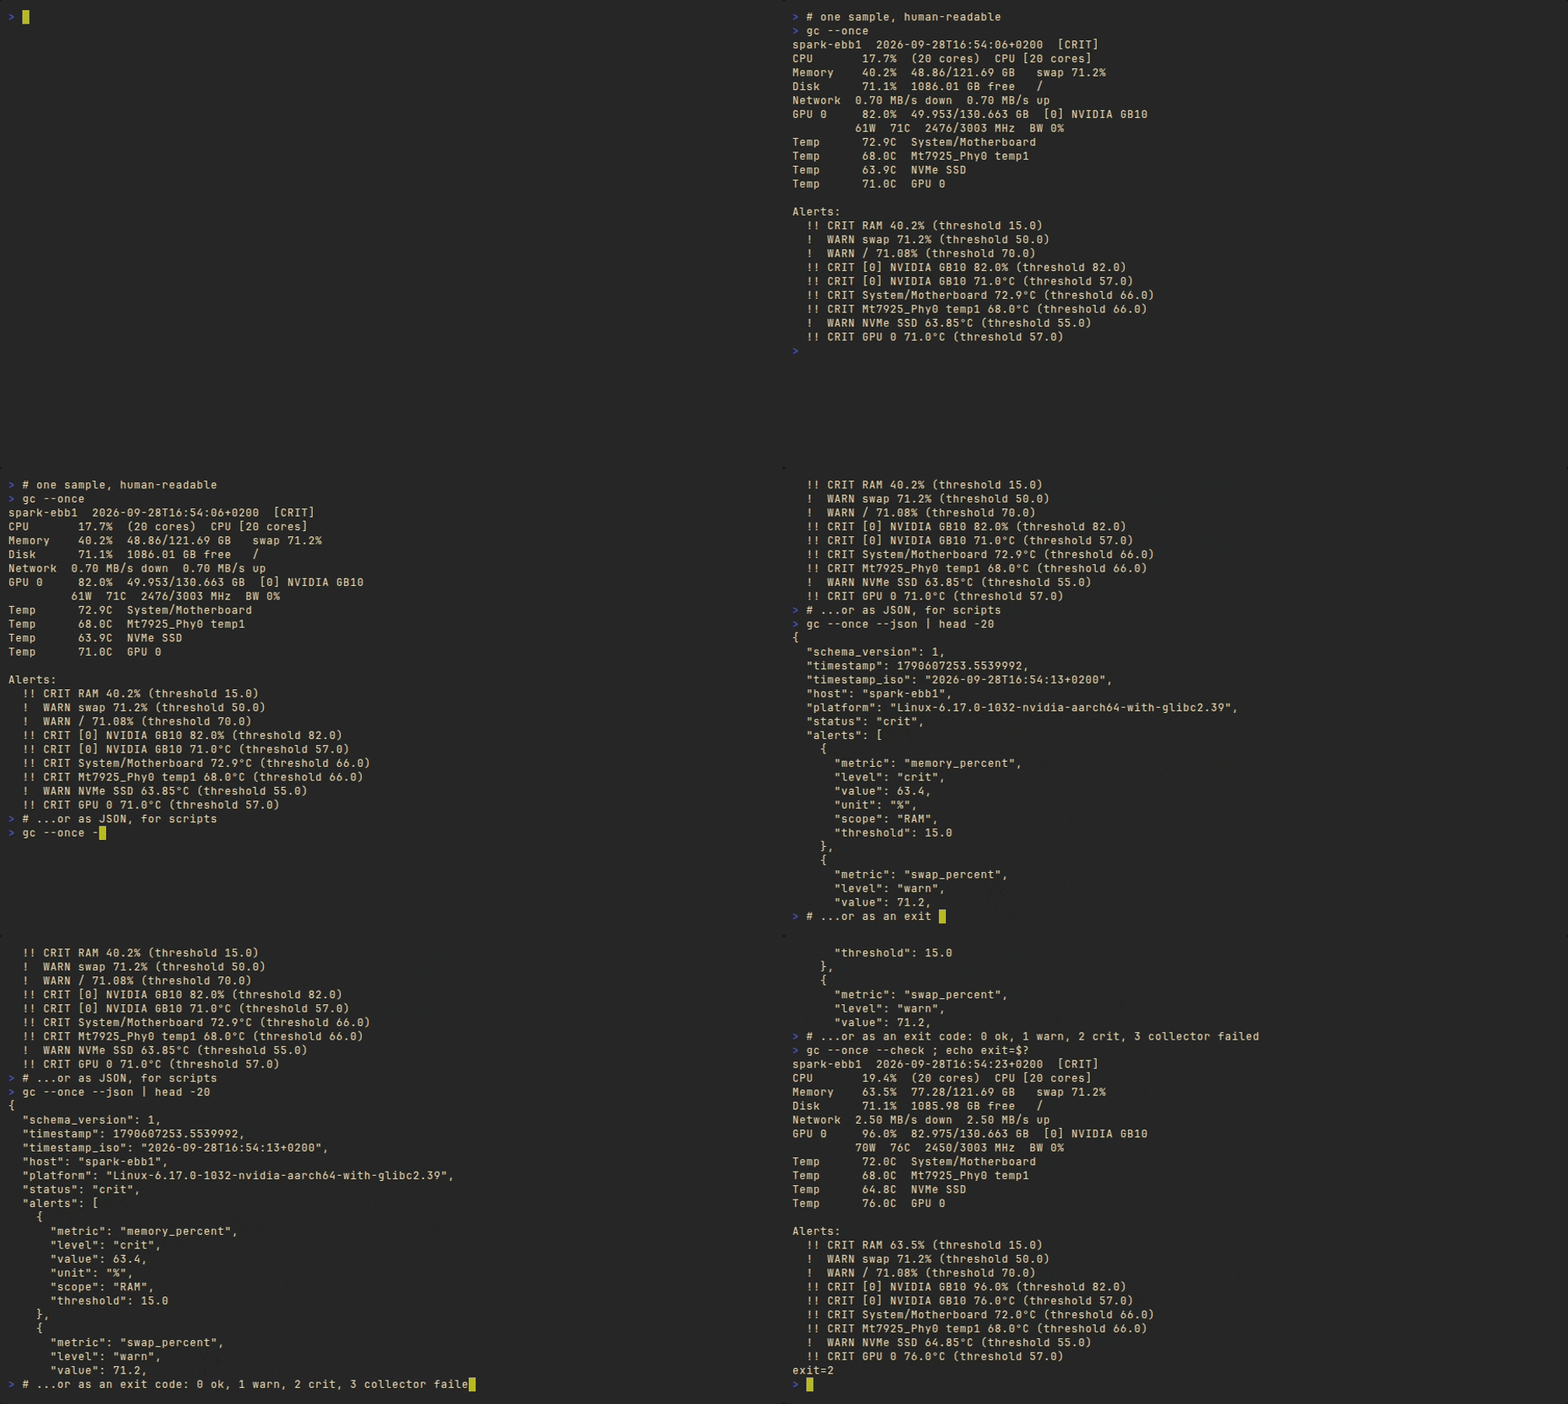
Rates are deltas, so --once samples twice and prints the second reading. --interval is the gap between them (half a second). --check uses the Nagios exit codes, so an existing check can call it as-is. If you parse the JSON, schema_version is the field that moves when the shape does.
The dashboard's mount filter applies here too. --all-mounts includes the ones that are normally hidden.
gc --stream flushes every line, so a reader can sit on readline. It stops on SIGTERM, SIGINT, SIGHUP, a closed stdout, or --stream-max-seconds (an hour, unless you pass 0).
MCP for AI clients
An MCP client can launch the local stdio server through uvx, without a separate gc install:
{
  "mcpServers": {
    "ground-control": {
      "command": "uvx",
      "args": ["--from", "ground-control-tui", "gc", "mcp"]
    }
  }
}
OpenCode uses a different configuration shape. Add this under mcp in ~/.config/opencode/opencode.json:
{
  "mcp": {
    "ground-control": {
      "type": "local",
      "command": ["uvx", "--from", "ground-control-tui", "gc", "mcp"]
    }
  }
}
MCP support is on PyPI from 2.2.0. For changes not released yet, use git+https://github.com/alberto-rota/ground-control.git in place of ground-control-tui. uvx downloads and caches the package on first launch; later launches reuse the cache. For a local checkout use its absolute path after --from, or, if gc is installed, launch gc mcp directly. Use an absolute path to uvx if your MCP client does not inherit your shell's PATH. Restart your MCP client after changing its configuration.
Every tool only reads. None of them can cancel, signal or change anything.
| Tool | What it returns |
|---|---|
get_hardware_status |
Compact current health: alerts, CPU, RAM, disks, network, and GPUs with power and bandwidth. |
get_hardware_metrics |
The full JSON snapshot, or one family with section (cpu, memory, disk, network, gpu, temperature_c). |
sample_hardware |
Min/mean/max/last over a short window (duration_seconds, interval_seconds), plus every alert seen during it. Use it for "is this busy?" questions, because single readings fluctuate. |
diagnose_gpus |
Interpreted findings per GPU: input-starved, throttled, VRAM nearly full, idle but holding memory, hot, or genuinely busy. Pass job_id to diagnose a Slurm job's GPUs. |
get_gpu_processes |
Each GPU's processes with their own GPU memory and SM utilization, optionally only some pids (plus their total, as the dashboard plots it), over a window, or inside a Slurm job. Includes gpu_scope. |
get_network_details |
Listening ports with bind address, exposure, owner and a service guess; interfaces with addresses, speed and rates; connection counts; TCP retransmits. Filter with listening (all, exposed, mine). Your own services come with an ssh -L tunnel hint. Pass job_id to read a job's compute node. |
get_alert_thresholds |
The warn/crit limits in effect, their direction, and the ignored mounts. |
list_slurm_jobs |
Your jobs (or another user's), running first, with GPUs, time used and pending reason. Filter with state. |
get_slurm_job |
One job's allocation, whether it is still running (and its final state if it ended), and live sstat usage. |
get_slurm_job_metrics |
A snapshot taken inside a running job through srun --overlap, so the CPUs and GPUs are the job's own. Each call takes a few seconds. |
The three Slurm tools are offered only when squeue is on PATH; gc mcp --no-slurm hides them. The server also provides four prompts, which clients show as slash commands: diagnose_slow_machine, diagnose_gpu_job (optional job_id), reach_service (optional job_id: find the port of a notebook or dashboard and how to tunnel to it) and explain_alerts.
Local readings come from the machine running the MCP server, with the same GPU allocation visibility, alert thresholds and disk ignore list as gc --once. --all-gpus and --all-mounts widen them, as they do for gc --once. On a cluster that machine is usually a login node, so use the Slurm tools to see a job's GPUs. The collector stays alive between calls. After 10 seconds idle the I/O counters are primed again, so rates always describe the present rather than the gap. No dashboard needs to be running. The server exits when the client closes its connection.
Keyboard
The footer shows the keys for the screen you are on. ? lists all of them, including the ones kept off the footer.
| Key | Action |
|---|---|
d / s / l |
Dashboard / Settings / Logs |
g / h / v / b |
Grid / horizontal / vertical / bento |
space |
Cycle the layouts |
r |
Refresh now |
+ / - |
Refresh faster / slower |
t |
Next theme |
a |
Toggle alerts |
[ / ] |
Previous / next panel |
ctrl+arrows |
Resize the focused panel's row or column |
shift+arrows |
Bento: make the focused panel span more or fewer columns / rows |
> / < |
Bento: more / fewer columns |
z |
Reset panel sizes (and bento spans) |
m |
Swap two panels (press it on each; esc cancels) |
x |
Hide the focused panel |
F |
Focus a running Slurm job (u in that list to stop) |
? |
Every shortcut |
q |
Quit |
With the CPU panel focused, 1 / 2 / 3 switch all cores, affinity cores, and your user's cores. With a GPU panel focused, 1 or p is the plot, 2 is the process list, and c clears a process selection. With the network panel focused, 1 / 2 / 3 are the plot, the interfaces and the listening ports.
Where things are saved
| What | Where |
|---|---|
| Config | ~/.config/ground-control/config.json |
| Themes you saved | ~/.config/ground-control/themes/*.json |
| Builtin themes | inside the installed package |
The config holds which panels are visible, the layout, the per-layout sizes, the refresh rate, the history length, the disk ignore prefixes, whether alerts are on, and the whole palette.
CLI reference
gc                                 the TUI, every panel this machine has
gc --cpu --ram --net               only those panels          (-c -r -n)
gc --disk --temp                   disks and temperatures     (-d -t)
gc -g                              every NVIDIA GPU
gc -g --gpu-index 0,1              only these GPUs
gc --all-gpus                      ignore CUDA_VISIBLE_DEVICES / the Slurm set
gc --slurm                         only the jobs panel        (--squeue is the same)
gc --debug                         surface exceptions
gc --log                           also write a log in the current directory

gc --once                          one snapshot, then exit
gc --once --json                   the same sample as JSON
gc --once --check                  exit 0 / 1 / 2 / 3
gc --once --interval SECONDS       gap between the two samples (default 0.5)
gc --once --all-mounts             include mounts the dashboard hides
gc --stream                        one JSON object per line
gc --stream --stream-max-seconds N stop after N seconds (0 = never, default 3600)

gc config                          open the config in $EDITOR
gc config --path                   print the config path
gc config --reset                  write the defaults back

gc theme --list                    builtin themes, plus yours
gc theme NAME                      apply a theme (restart to see it)
gc theme --monokai                ...or by flag
gc theme --save-as NAME            save the current palette
gc theme --delete NAME             delete a theme you saved
gc --help prints the same options. groundcontrol accepts every flag gc does.
Known limits
On a big node, with a lot of disks, cores and GPUs, collecting and drawing every panel can fall behind the refresh rate. Hiding panels, or launching with only the ones you want (gc --cpu --gpu), is the practical fix. The config file is the other one: edit it and restart.
GPU metrics need NVIDIA and NVML. A MiG device may show Usage UNAV when utilization is not exposed. Temperatures depend on what the kernel actually publishes under hwmon, and some machines have nothing to show.
Contributing
Pull requests are welcome. Fork, branch, open a PR. Issues are here.
Every animation above comes from a vhs tape in demo/tapes/. demo/record.sh re-records them. demo/README.md is the note for when the UI changes and the gifs need to follow.
License
GNU General Public License v3.0.
Author
Alberto Rota, alberto_rota@outlook.com, @alberto-rota.
1 maintainer

Metadata
1 maintainer
Release files for ground-control-tui 2.2.1
For a detailed explanation of source distributions (sdists) and built distributions (wheels), please see the package formats documentation.
Source distribution (sdist)
| File | Size | Uploaded | |
|---|---|---|---|
| ground_control_tui-2.2.1.tar.gz | 277.4 kB | Details |
Built distribution (wheel)
| File | Interpreter | ABI | Platform | Reset |
|---|---|---|---|---|
| ground_control_tui-2.2.1-py3-none-any.whl | Python 3 | none | any | Details |
Total release size: 527.1 kB
Release files / ground_control_tui-2.2.1.tar.gz
| Download URL | ground_control_tui-2.2.1.tar.gz |
|---|---|
| Size | 277.4 kB |
| Tags | Source |
|
SHA-256 checksum How to use checksums |
a82107c3a0d221be3b0c1a100c5ea8bd511bb9f8f233414246729bca21887e7c
|
|
BLAKE2b-256 checksum How to use checksums |
dfdeb9b9d663d121a8818999c1d7953afaa93472ebf5b7368d286611f4d1bcb0
|
| Upload date | |
|
Uploaded using Trusted Publishing? What is trusted publishing? |
Yes |
| Uploaded via |
twine/7.0.0 CPython/3.13.14
|
Provenance
Provenance describes where a file came from. On PyPI, provenance is shared via attestations, which provide a verifiable record of the build or publishing details. View details, limitations and caveats.


PyPI Publish Attestation
PyPI verified that this artifact, at this checksum, originated from the publisher listed below.
Signed by GitHub Actions, verified by PyPI on Oct 13, 2026.
Transparency logRelease files / ground_control_tui-2.2.1-py3-none-any.whl
| Download URL | ground_control_tui-2.2.1-py3-none-any.whl |
|---|---|
| Size | 249.7 kB |
| Tags | Python 3 |
|
SHA-256 checksum How to use checksums |
58a549dbb8d52b30add416fed778f1dd4f7b78ddd9b960d26037cb79d8ad30bf
|
|
BLAKE2b-256 checksum How to use checksums |
07642c73f5f8dfa8b961eedfe1310a8d95111a7bdbf53ba0f2c216c9a12051cc
|
| Upload date | |
|
Uploaded using Trusted Publishing? What is trusted publishing? |
Yes |
| Uploaded via |
twine/7.0.0 CPython/3.13.14
|
Provenance
Provenance describes where a file came from. On PyPI, provenance is shared via attestations, which provide a verifiable record of the build or publishing details. View details, limitations and caveats.
PyPI Publish Attestation
PyPI verified that this artifact, at this checksum, originated from the publisher listed below.
Signed by GitHub Actions, verified by PyPI on Oct 13, 2026.
Transparency log













