Multi-class confusion matrix library in Python


Project description


Table of contents
- Overview
- Installation
- Usage
- Document
- Issues & Bug Reports
- Todo
- Outputs
- Dependencies
- Contribution
- References
- Cite
- Authors
- License
- Donate
- Changelog
Overview
PyCM is a multi-class confusion matrix library written in Python that supports both input data vectors and direct matrix, and a proper tool for post-classification model evaluation that supports most classes and overall statistics parameters. PyCM is the swiss-army knife of confusion matrices, targeted mainly at data scientists that need a broad array of metrics for predictive models and an accurate evaluation of large variety of classifiers.
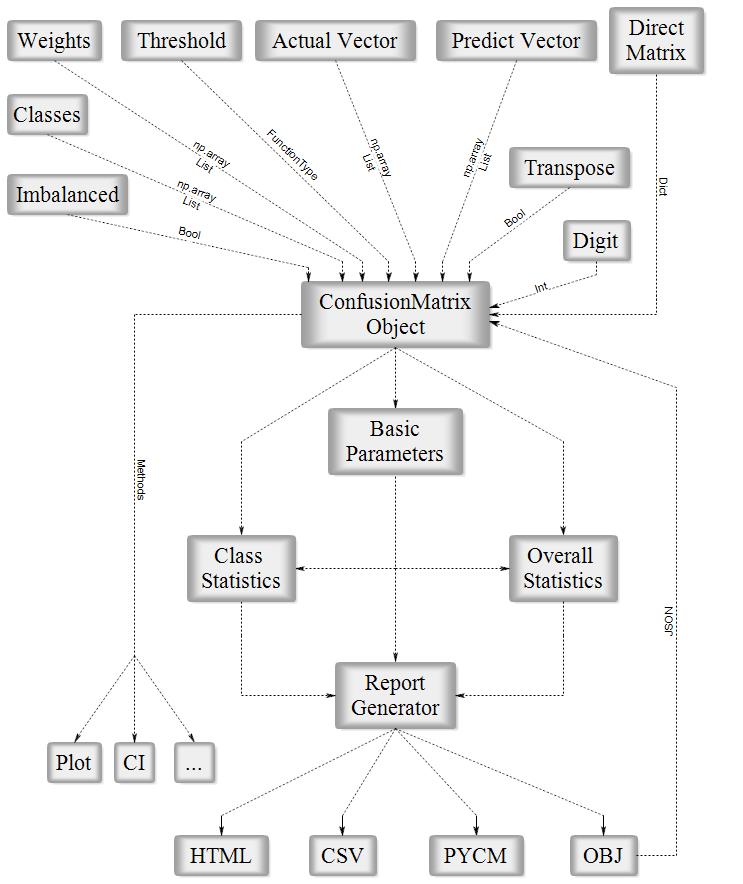
Fig1. PyCM Block Diagram
| Open Hub |  |
| PyPI Counter |  |
| Github Stars |  |
| Branch | master | dev |
| Travis |  |
 |
| AppVeyor |  |
 |
Installation
Source code
- Download Version 1.6 or Latest Source
- Run
pip install -r requirements.txtorpip3 install -r requirements.txt(Need root access) - Run
python3 setup.py installorpython setup.py install(Need root access)
PyPI
- Check Python Packaging User Guide
- Run
pip install pycm==1.6orpip3 install pycm==1.6(Need root access)
Conda
- Check Conda Managing Package
conda install -c sepandhaghighi pycm(Need root access)
Easy install
- Run
easy_install --upgrade pycm(Need root access)
Usage
From vector
>>> from pycm import *
>>> y_actu = [2, 0, 2, 2, 0, 1, 1, 2, 2, 0, 1, 2] # or y_actu = numpy.array([2, 0, 2, 2, 0, 1, 1, 2, 2, 0, 1, 2])
>>> y_pred = [0, 0, 2, 1, 0, 2, 1, 0, 2, 0, 2, 2] # or y_pred = numpy.array([0, 0, 2, 1, 0, 2, 1, 0, 2, 0, 2, 2])
>>> cm = ConfusionMatrix(actual_vector=y_actu, predict_vector=y_pred) # Create CM From Data
>>> cm.classes
[0, 1, 2]
>>> cm.table
{0: {0: 3, 1: 0, 2: 0}, 1: {0: 0, 1: 1, 2: 2}, 2: {0: 2, 1: 1, 2: 3}}
>>> print(cm)
Predict 0 1 2
Actual
0 3 0 0
1 0 1 2
2 2 1 3
Overall Statistics :
95% CI (0.30439,0.86228)
AUNP 0.66667
AUNU 0.69444
Bennett S 0.375
CBA 0.47778
Chi-Squared 6.6
Chi-Squared DF 4
Conditional Entropy 0.95915
Cramer V 0.5244
Cross Entropy 1.59352
Gwet AC1 0.38931
Hamming Loss 0.41667
Joint Entropy 2.45915
KL Divergence 0.09352
Kappa 0.35484
Kappa 95% CI (-0.07708,0.78675)
Kappa No Prevalence 0.16667
Kappa Standard Error 0.22036
Kappa Unbiased 0.34426
Lambda A 0.16667
Lambda B 0.42857
Mutual Information 0.52421
NIR 0.5
Overall ACC 0.58333
Overall CEN 0.46381
Overall J (1.225,0.40833)
Overall MCC 0.36667
Overall MCEN 0.51894
Overall RACC 0.35417
Overall RACCU 0.36458
P-Value 0.38721
PPV Macro 0.56667
PPV Micro 0.58333
Phi-Squared 0.55
RCI 0.34947
RR 4.0
Reference Entropy 1.5
Response Entropy 1.48336
SOA1(Landis & Koch) Fair
SOA2(Fleiss) Poor
SOA3(Altman) Fair
SOA4(Cicchetti) Poor
Scott PI 0.34426
Standard Error 0.14232
TPR Macro 0.61111
TPR Micro 0.58333
Zero-one Loss 5
Class Statistics :
Classes 0 1 2
ACC(Accuracy) 0.83333 0.75 0.58333
AUC(Area under the roc curve) 0.88889 0.61111 0.58333
AUCI(Auc value interpretation) Very Good Fair Poor
BM(Informedness or bookmaker informedness) 0.77778 0.22222 0.16667
CEN(Confusion entropy) 0.25 0.49658 0.60442
DOR(Diagnostic odds ratio) None 4.0 2.0
DP(Discriminant power) None 0.33193 0.16597
DPI(Discriminant power interpretation) None Poor Poor
ERR(Error rate) 0.16667 0.25 0.41667
F0.5(F0.5 score) 0.65217 0.45455 0.57692
F1(F1 score - harmonic mean of precision and sensitivity) 0.75 0.4 0.54545
F2(F2 score) 0.88235 0.35714 0.51724
FDR(False discovery rate) 0.4 0.5 0.4
FN(False negative/miss/type 2 error) 0 2 3
FNR(Miss rate or false negative rate) 0.0 0.66667 0.5
FOR(False omission rate) 0.0 0.2 0.42857
FP(False positive/type 1 error/false alarm) 2 1 2
FPR(Fall-out or false positive rate) 0.22222 0.11111 0.33333
G(G-measure geometric mean of precision and sensitivity) 0.7746 0.40825 0.54772
IS(Information score) 1.26303 1.0 0.26303
J(Jaccard index) 0.6 0.25 0.375
MCC(Matthews correlation coefficient) 0.68313 0.2582 0.16903
MCEN(Modified confusion entropy) 0.26439 0.5 0.6875
MK(Markedness) 0.6 0.3 0.17143
N(Condition negative) 9 9 6
NLR(Negative likelihood ratio) 0.0 0.75 0.75
NPV(Negative predictive value) 1.0 0.8 0.57143
P(Condition positive or support) 3 3 6
PLR(Positive likelihood ratio) 4.5 3.0 1.5
PLRI(Positive likelihood ratio interpretation) Poor Poor Poor
POP(Population) 12 12 12
PPV(Precision or positive predictive value) 0.6 0.5 0.6
PRE(Prevalence) 0.25 0.25 0.5
RACC(Random accuracy) 0.10417 0.04167 0.20833
RACCU(Random accuracy unbiased) 0.11111 0.0434 0.21007
TN(True negative/correct rejection) 7 8 4
TNR(Specificity or true negative rate) 0.77778 0.88889 0.66667
TON(Test outcome negative) 7 10 7
TOP(Test outcome positive) 5 2 5
TP(True positive/hit) 3 1 3
TPR(Sensitivity, recall, hit rate, or true positive rate) 1.0 0.33333 0.5
Y(Youden index) 0.77778 0.22222 0.16667
dInd(Distance index) 0.22222 0.67586 0.60093
sInd(Similarity index) 0.84287 0.52209 0.57508
>>> cm.print_matrix()
Predict 0 1 2
Actual
0 3 0 0
1 0 1 2
2 2 1 3
>>> cm.print_normalized_matrix()
Predict 0 1 2
Actual
0 1.0 0.0 0.0
1 0.0 0.33333 0.66667
2 0.33333 0.16667 0.5
>>> cm.print_matrix(one_vs_all=True,class_name=0) # One-Vs-All, new in version 1.4
Predict 0 ~
Actual
0 3 0
~ 2 7
Direct CM
>>> from pycm import *
>>> cm2 = ConfusionMatrix(matrix={"Class1": {"Class1": 1, "Class2":2}, "Class2": {"Class1": 0, "Class2": 5}}) # Create CM Directly
>>> cm2
pycm.ConfusionMatrix(classes: ['Class1', 'Class2'])
>>> print(cm2)
Predict Class1 Class2
Actual
Class1 1 2
Class2 0 5
Overall Statistics :
95% CI (0.44994,1.05006)
AUNP 0.66667
AUNU 0.66667
Bennett S 0.5
CBA 0.52381
Chi-Squared 1.90476
Chi-Squared DF 1
Conditional Entropy 0.34436
Cramer V 0.48795
Cross Entropy 1.2454
Gwet AC1 0.6
Hamming Loss 0.25
Joint Entropy 1.29879
KL Divergence 0.29097
Kappa 0.38462
Kappa 95% CI (-0.354,1.12323)
Kappa No Prevalence 0.5
Kappa Standard Error 0.37684
Kappa Unbiased 0.33333
Lambda A 0.33333
Lambda B 0.0
Mutual Information 0.1992
NIR 0.625
Overall ACC 0.75
Overall CEN 0.44812
Overall J (1.04762,0.52381)
Overall MCC 0.48795
Overall MCEN 0.29904
Overall RACC 0.59375
Overall RACCU 0.625
P-Value 0.36974
PPV Macro 0.85714
PPV Micro 0.75
Phi-Squared 0.2381
RCI 0.20871
RR 4.0
Reference Entropy 0.95443
Response Entropy 0.54356
SOA1(Landis & Koch) Fair
SOA2(Fleiss) Poor
SOA3(Altman) Fair
SOA4(Cicchetti) Poor
Scott PI 0.33333
Standard Error 0.15309
TPR Macro 0.66667
TPR Micro 0.75
Zero-one Loss 2
Class Statistics :
Classes Class1 Class2
ACC(Accuracy) 0.75 0.75
AUC(Area under the roc curve) 0.66667 0.66667
AUCI(Auc value interpretation) Fair Fair
BM(Informedness or bookmaker informedness) 0.33333 0.33333
CEN(Confusion entropy) 0.5 0.43083
DOR(Diagnostic odds ratio) None None
DP(Discriminant power) None None
DPI(Discriminant power interpretation) None None
ERR(Error rate) 0.25 0.25
F0.5(F0.5 score) 0.71429 0.75758
F1(F1 score - harmonic mean of precision and sensitivity) 0.5 0.83333
F2(F2 score) 0.38462 0.92593
FDR(False discovery rate) 0.0 0.28571
FN(False negative/miss/type 2 error) 2 0
FNR(Miss rate or false negative rate) 0.66667 0.0
FOR(False omission rate) 0.28571 0.0
FP(False positive/type 1 error/false alarm) 0 2
FPR(Fall-out or false positive rate) 0.0 0.66667
G(G-measure geometric mean of precision and sensitivity) 0.57735 0.84515
IS(Information score) 1.41504 0.19265
J(Jaccard index) 0.33333 0.71429
MCC(Matthews correlation coefficient) 0.48795 0.48795
MCEN(Modified confusion entropy) 0.38998 0.51639
MK(Markedness) 0.71429 0.71429
N(Condition negative) 5 3
NLR(Negative likelihood ratio) 0.66667 0.0
NPV(Negative predictive value) 0.71429 1.0
P(Condition positive or support) 3 5
PLR(Positive likelihood ratio) None 1.5
PLRI(Positive likelihood ratio interpretation) None Poor
POP(Population) 8 8
PPV(Precision or positive predictive value) 1.0 0.71429
PRE(Prevalence) 0.375 0.625
RACC(Random accuracy) 0.04688 0.54688
RACCU(Random accuracy unbiased) 0.0625 0.5625
TN(True negative/correct rejection) 5 1
TNR(Specificity or true negative rate) 1.0 0.33333
TON(Test outcome negative) 7 1
TOP(Test outcome positive) 1 7
TP(True positive/hit) 1 5
TPR(Sensitivity, recall, hit rate, or true positive rate) 0.33333 1.0
Y(Youden index) 0.33333 0.33333
dInd(Distance index) 0.66667 0.66667
sInd(Similarity index) 0.5286 0.5286
>>> cm3 = ConfusionMatrix(matrix={"Class1": {"Class1": 1, "Class2":0}, "Class2": {"Class1": 2, "Class2": 5}},transpose=True) # Transpose Matrix
>>> cm3.print_matrix()
Predict Class1 Class2
Actual
Class1 1 2
Class2 0 5
matrix()andnormalized_matrix()renamed toprint_matrix()andprint_normalized_matrix()inversion 1.5
Activation threshold
threshold is added in version 0.9 for real value prediction.
For more information visit Example3
Load from file
file is added in version 0.9.5 in order to load saved confusion matrix with .obj format generated by save_obj method.
For more information visit Example4
Sample weights
sample_weight is added in version 1.2
For more information visit Example5
Transpose
transpose is added in version 1.2 in order to transpose input matrix (only in Direct CM mode)
Relabel
relabel method is added in version 1.5 in order to change ConfusionMatrix classnames.
>>> cm.relabel(mapping={0:"L1",1:"L2",2:"L3"})
>>> cm
pycm.ConfusionMatrix(classes: ['L1', 'L2', 'L3'])
Online help
online_help function is added in version 1.1 in order to open each statistics definition in web browser
>>> from pycm import online_help
>>> online_help("J")
>>> online_help("SOA1(Landis & Koch)")
>>> online_help(2)
- List of items are available by calling
online_help()(without argument)
Acceptable data types
actual_vector: pythonlistor numpyarrayof any stringable objectspredict_vector: pythonlistor numpyarrayof any stringable objectsmatrix:dictdigit:intthreshold:FunctionType (function or lambda)file:File objectsample_weight: pythonlistor numpyarrayof any stringable objectstranspose:bool
- Run
help(ConfusionMatrix)forConfusionMatrixobject details
For more information visit here
Issues & bug reports
Just fill an issue and describe it. We'll check it ASAP! or send an email to shaghighi@ce.sharif.edu.
Todo
Moved here
Outputs
Dependencies

Contribution
Changes and improvements are more than welcome! ❤️ Feel free to fork and open a pull request. Please make your changes in a specific branch and request to pull into dev
Remember to write a few tests for your code before sending pull requests.
References
1- J. R. Landis, G. G. Koch, “The measurement of observer agreement for categorical data. Biometrics,” in International Biometric Society, pp. 159–174, 1977.
2- D. M. W. Powers, “Evaluation: from precision, recall and f-measure to roc, informedness, markedness & correlation,” in Journal of Machine Learning Technologies, pp.37-63, 2011.
3- C. Sammut, G. Webb, “Encyclopedia of Machine Learning” in Springer, 2011.
4- J. L. Fleiss, “Measuring nominal scale agreement among many raters,” in Psychological Bulletin, pp. 378-382.
5- D.G. Altman, “Practical Statistics for Medical Research,” in Chapman and Hall, 1990.
6- K. L. Gwet, “Computing inter-rater reliability and its variance in the presence of high agreement,” in The British Journal of Mathematical and Statistical Psychology, pp. 29–48, 2008.”
7- W. A. Scott, “Reliability of content analysis: The case of nominal scaling,” in Public Opinion Quarterly, pp. 321–325, 1955.
8- E. M. Bennett, R. Alpert, and A. C. Goldstein, “Communication through limited response questioning,” in The Public Opinion Quarterly, pp. 303–308, 1954.
9- D. V. Cicchetti, "Guidelines, criteria, and rules of thumb for evaluating normed and standardized assessment instruments in psychology," in Psychological Assessment, pp. 284–290, 1994.
10- R.B. Davies, "Algorithm AS155: The Distributions of a Linear Combination of χ2 Random Variables," in Journal of the Royal Statistical Society, pp. 323–333, 1980.
11- S. Kullback, R. A. Leibler "On information and sufficiency," in Annals of Mathematical Statistics, pp. 79–86, 1951.
12- L. A. Goodman, W. H. Kruskal, "Measures of Association for Cross Classifications, IV: Simplification of Asymptotic Variances," in Journal of the American Statistical Association, pp. 415–421, 1972.
13- L. A. Goodman, W. H. Kruskal, "Measures of Association for Cross Classifications III: Approximate Sampling Theory," in Journal of the American Statistical Association, pp. 310–364, 1963.
14- T. Byrt, J. Bishop and J. B. Carlin, “Bias, prevalence, and kappa,” in Journal of Clinical Epidemiology pp. 423-429, 1993.
15- M. Shepperd, D. Bowes, and T. Hall, “Researcher Bias: The Use of Machine Learning in Software Defect Prediction,” in IEEE Transactions on Software Engineering, pp. 603-616, 2014.
16- X. Deng, Q. Liu, Y. Deng, and S. Mahadevan, “An improved method to construct basic probability assignment based on the confusion matrix for classification problem, ” in Information Sciences, pp.250-261, 2016.
17- Wei, J.-M., Yuan, X.-Y., Hu, Q.-H., Wang, S.-Q.: A novel measure for evaluating classifiers. Expert Systems with Applications, Vol 37, 3799–3809 (2010).
18- Kononenko I. and Bratko I. Information-based evaluation criterion for classifier’s performance. Machine Learning, 6:67–80, 1991.
19- Delgado R., Núñez-González J.D. (2019) Enhancing Confusion Entropy as Measure for Evaluating Classifiers. In: Graña M. et al. (eds) International Joint Conference SOCO’18-CISIS’18-ICEUTE’18. SOCO’18-CISIS’18-ICEUTE’18 2018. Advances in Intelligent Systems and Computing, vol 771. Springer, Cham
20- Gorodkin J (2004) Comparing two K-category assignments by a K-category correlation coefficient. Computational Biology and Chemistry 28: 367–374
21- Freitas C.O.A., de Carvalho J.M., Oliveira J., Aires S.B.K., Sabourin R. (2007) Confusion Matrix Disagreement for Multiple Classifiers. In: Rueda L., Mery D., Kittler J. (eds) Progress in Pattern Recognition, Image Analysis and Applications. CIARP 2007. Lecture Notes in Computer Science, vol 4756. Springer, Berlin, Heidelberg
22- Branco P., Torgo L., Ribeiro R.P. (2017) Relevance-Based Evaluation Metrics for Multi-class Imbalanced Domains. In: Kim J., Shim K., Cao L., Lee JG., Lin X., Moon YS. (eds) Advances in Knowledge Discovery and Data Mining. PAKDD 2017. Lecture Notes in Computer Science, vol 10234. Springer, Cham
23- Ballabio, D., Grisoni, F. and Todeschini, R. (2018). Multivariate comparison of classification performance measures. Chemometrics and Intelligent Laboratory Systems, 174, pp.33-44.
24- Cohen, Jacob. 1960. A coefficient of agreement for nominal scales. Educational And Psychological Measurement 20:37-46
25- Siegel, Sidney and N. John Castellan, Jr. 1988. Nonparametric Statistics for the Behavioral Sciences. McGraw Hill.
26- Cramér, Harald. 1946. Mathematical Methods of Statistics. Princeton: Princeton University Press, page 282 (Chapter 21. The two-dimensional case)
27- Matthews, B. W. (1975). "Comparison of the predicted and observed secondary structure of T4 phage lysozyme". Biochimica et Biophysica Acta (BBA) - Protein Structure. 405 (2): 442–451.
28- Swets JA. (1973). "The relative operating characteristic in Psychology". Science. 182 (14116): 990–1000.
29- Jaccard, Paul (1901), "Étude comparative de la distribution florale dans une portion des Alpes et des Jura", Bulletin de la Société Vaudoise des Sciences Naturelles, 37: 547–579.
30- Thomas M. Cover and Joy A. Thomas. 2006. Elements of Information Theory (Wiley Series in Telecommunications and Signal Processing). Wiley-Interscience, New York, NY, USA.
31- Keeping, E.S. (1962) Introduction to Statistical Inference. D. Van Nostrand, Princeton, NJ.
32- Sindhwani V, Bhattacharge P, Rakshit S (2001) Information theoretic feature crediting in multiclass Support Vector Machines. In: Grossman R, Kumar V, editors, Proceedings First SIAM International Conference on Data Mining, ICDM01. SIAM, pp. 1–18.
33- Bekkar, Mohamed & Djema, Hassiba & Alitouche, T.A.. (2013). Evaluation measures for models assessment over imbalanced data sets. Journal of Information Engineering and Applications. 3. 27-38.
34- Youden W, (1950),« Index for rating diagnostic tests »; Cancer, 3 :32–35
Cite
If you use PyCM in your research , please cite this JOSS paper :
Haghighi, S., Jasemi, M., Hessabi, S. and Zolanvari, A. (2018). PyCM: Multiclass confusion matrix library in Python. Journal of Open Source Software, 3(25), p.729.
@article{Haghighi2018,
  doi = {10.21105/joss.00729},
  url = {https://doi.org/10.21105/joss.00729},
  year  = {2018},
  month = {may},
  publisher = {The Open Journal},
  volume = {3},
  number = {25},
  pages = {729},
  author = {Sepand Haghighi and Masoomeh Jasemi and Shaahin Hessabi and Alireza Zolanvari},
  title = {{PyCM}: Multiclass confusion matrix library in Python},
  journal = {Journal of Open Source Software}
}
Download PyCM.bib
| JOSS |  |
| Zenodo |  |
| Researchgate |  |
License

Donate to our project
If you do like our project and we hope that you do, can you please support us? Our project is not and is never going to be working for profit. We need the money just so we can continue doing what we do ;-) .

Changelog
All notable changes to this project will be documented in this file.
The format is based on Keep a Changelog and this project adheres to Semantic Versioning.
Unreleased
1.6 - 2018-12-06
Added
- AUC Value Interpretation (AUCI)
- Example-6
- Anaconda cloud package
Changed
overall_paramandclass_paramarguments added tostat,save_statandsave_htmlmethodsclass_paramargument added tosave_csvmethod_removed from overall statistics namesREADME.mdmodified- Document modified
1.5 - 2018-11-26
Added
- Relative Classifier Information (RCI)
- Discriminator Power (DP)
- Youden's Index (Y)
- Discriminant Power Interpretation (DPI)
- Positive Likelihood Ratio Interpretation (PLRI)
__len__methodrelabelmethod__class_stat_init__function__overall_stat_init__functionmatrixattribute as dictnormalized_matrixattribute as dictnormalized_tableattribute as dict
Changed
README.mdmodified- Document modified
LR+renamed toPLRLR-renamed toNLRnormalized_matrixmethod renamed toprint_normalized_matrixmatrixmethod renamed toprint_matrixentropy_calcfixedcross_entropy_calcfixedconditional_entropy_calcfixedprint_tablebug for large numbers fixed- JSON key bug in
save_objfixed transposebug insave_objfixedPython 3.7added to.travis.yaml&appveyor.yml
1.4 - 2018-11-12
Added
- Area Under Curve (AUC)
- AUNU
- AUNP
- Class Balance Accuracy (CBA)
- Global Performance Index (RR)
- Overall MCC
- Distance index (dInd)
- Similarity index (sInd)
one_vs_alldev-requirements.txt
Changed
README.mdmodified- Document modified
save_statmodifiedrequirements.txtmodified
1.3 - 2018-10-10
Added
- Confusion Entropy
- Overall Confusion Entropy
- Modified Confusion Entropy
- Overall Modified Confusion Entropy
- Information Score
Changed
README.mdmodified
1.2 - 2018-10-01
Added
- NIR (No Information Rate)
- P-Value
sample_weighttranspose
Changed
README.mdmodified- Key error in some parameters fixed
OSXenv added to.travis.yml
1.1 - 2018-09-08
Added
- Zero-one loss
- Support
online_helpfunction
Changed
README.mdmodifiedhtml_tablefunction modifiedtable_printfunction modifiednormalized_table_printfunction modified
1.0 - 2018-08-30
Added
- Hamming loss
Changed
README.mdmodified
0.9.5 - 2018-07-08
Added
- Obj load
- Obj save
- Example-4
Changed
README.mdmodified- Block diagram updated
0.9 - 2018-06-28
Added
- Activation Threshold
- Example-3
- Jaccard index
- Overall Jaccard index
Changed
README.mdmodifiedsetup.pymodified
0.8.6 - 2018-05-31
Added
- Example section in document
- Python 2.7 CI
- JOSS paper pdf
Changed
- Cite section
- ConfusionMatrix docstring
- round function changed to numpy.around
README.mdmodified
0.8.5 - 2018-05-21
Added
- Example-1 (Comparison of three different classifiers)
- Example-2 (How to plot via matplotlib)
- JOSS paper
- ConfusionMatrix docstring
Changed
- Table size in HTML report
- Test system
README.mdmodified
0.8.1 - 2018-03-22
Added
- Goodman and Kruskal's lambda B
- Goodman and Kruskal's lambda A
- Cross Entropy
- Conditional Entropy
- Joint Entropy
- Reference Entropy
- Response Entropy
- Kullback-Liebler divergence
- Direct ConfusionMatrix
- Kappa Unbiased
- Kappa No Prevalence
- Random Accuracy Unbiased
pycmVectorErrorclasspycmMatrixErrorclass- Mutual Information
- Support
numpyarrays
Changed
- Notebook file updated
Removed
pycmErrorclass
0.7 - 2018-02-26
Added
- Cramer's V
- 95% Confidence interval
- Chi-Squared
- Phi-Squared
- Chi-Squared DF
- Standard error
- Kappa standard error
- Kappa 95% confidence interval
- Cicchetti benchmark
Changed
- Overall statistics color in HTML report
- Parameters description link in HTML report
0.6 - 2018-02-21
Added
- CSV report
- Changelog
- Output files
digitparameter toConfusionMatrixobject
Changed
- Confusion matrix color in HTML report
- Parameters description link in HTML report
- Capitalize descriptions
0.5 - 2018-02-17
Added
- Scott's pi
- Gwet's AC1
- Bennett S score
- HTML report
0.4 - 2018-02-05
Added
- TPR Micro/Macro
- PPV Micro/Macro
- RACC overall
- ERR(Error rate)
- FBeta-Score
- F0.5
- F2
- Fleiss benchmark
- Altman benchmark
- Output file(.pycm)
Changed
- Class with zero item
- Normalized matrix
Removed
- Kappa and SOA for each class
0.3 - 2018-01-27
Added
- Kappa
- Random accuracy
- Landis and Koch benchmark
overall_stat
0.2 - 2018-01-24
Added
- Population
- Condition positive
- Condition negative
- Test outcome positive
- Test outcome negative
- Prevalence
- G-measure
- Matrix method
- Normalized matrix method
- Params method
Changed
statistic_resulttoclass_statparamstostat
0.1 - 2018-01-22
Added
- ACC
- BM
- DOR
- F1-Score
- FDR
- FNR
- FOR
- FPR
- LR+
- LR-
- MCC
- MK
- NPV
- PPV
- TNR
- TPR
- documents and
README.md
Release history Release notifications | RSS feed


Download files
Download the file for your platform. If you're not sure which to choose, learn more about installing packages.
Source Distribution
Built Distribution
Filter files by name, interpreter, ABI, and platform.
If you're not sure about the file name format, learn more about wheel file names.
Copy a direct link to the current filters
File details
Details for the file pycm-1.6.tar.gz.
File metadata
- Download URL: pycm-1.6.tar.gz
- Upload date:
- Size: 571.6 kB
- Tags: Source
- Uploaded using Trusted Publishing? No
- Uploaded via: twine/1.12.1 pkginfo/1.4.2 requests/2.20.1 setuptools/18.5 requests-toolbelt/0.8.0 tqdm/4.28.1 CPython/3.4.3
File hashes
| Algorithm | Hash digest | |
|---|---|---|
| SHA256 |
0dfff688a3697da72482e0e22635f877f8d183dcb63b25bd27a035a9650790c2
|
|
| MD5 |
836fe3863bb5a5cee59044de93c9fe11
|
|
| BLAKE2b-256 |
7ee4d60c8e8a38b0ebe2b25ef4fbe1cf1ffe1ad41a7376f717adf81555948fc9
|
File details
Details for the file pycm-1.6-py2.py3-none-any.whl.
File metadata
- Download URL: pycm-1.6-py2.py3-none-any.whl
- Upload date:
- Size: 41.0 kB
- Tags: Python 2, Python 3
- Uploaded using Trusted Publishing? No
- Uploaded via: twine/1.12.1 pkginfo/1.4.2 requests/2.20.1 setuptools/18.5 requests-toolbelt/0.8.0 tqdm/4.28.1 CPython/3.4.3
File hashes
| Algorithm | Hash digest | |
|---|---|---|
| SHA256 |
0e8f8bb55701333ce9fbedebe914129a3c2eee6e01debfb373c5d595ba31c988
|
|
| MD5 |
e9541b79b30fd8cf3f4285340923361f
|
|
| BLAKE2b-256 |
25b46e437842173d314a0f70126049ece109a5992969d03aab8be011dff6aeea
|


