
Drop-in observability for LangGraph and CrewAI — captures every run, node, tool call, token count, prompt, and response into MongoDB, PostgreSQL, or any OpenTelemetry-compatible collector
Verified details
These details have been verified by PyPIProject links
GitHub Statistics
Maintainers

Project description
stakeout-agent
Drop-in observability and alerting for LangGraph and CrewAI.
One callback. Every run, node, tool call, token count, prompt, and response — captured automatically into MongoDB, PostgreSQL, or any OpenTelemetry-compatible collector. Sliding-window alerts fire to Slack, PagerDuty, or any webhook the moment error rates or latency spike. An MCP server lets agents query their own run history at runtime. No changes to your agent code.






Install and go
# LangGraph + MongoDB
pip install 'stakeout-agent[langgraph,mongodb]'

# LangGraph + PostgreSQL
pip install 'stakeout-agent[langgraph,postgres]'

# LangGraph + OpenTelemetry (Jaeger, Datadog, Grafana Tempo, Honeycomb, …)
pip install 'stakeout-agent[langgraph,otel]'

# CrewAI + MongoDB
pip install 'stakeout-agent[crewai,mongodb]'

# CrewAI + PostgreSQL
pip install 'stakeout-agent[crewai,postgres]'

# CrewAI + OpenTelemetry
pip install 'stakeout-agent[crewai,otel]'

# MCP server (expose run history to any MCP-aware agent)
pip install 'stakeout-agent[mcp]'
from stakeout_agent import LangGraphMonitorCallback

monitor = LangGraphMonitorCallback(graph_id="my_graph", thread_id="thread_123")
result = graph.invoke(inputs, config={"callbacks": [monitor]})
That's it. Every node execution, tool call, latency, token count, prompt, response, and error is now in your database.
How it works
graph LR
    A[Your LangGraph / CrewAI app] -->|callback| B[stakeout-agent]
    B --> C[(MongoDB)]
    B --> D[(PostgreSQL)]
    B --> F[OTEL Collector]
    C --> E[Dashboard / your queries]
    D --> E
    F --> G[Jaeger / Datadog / Grafana / Honeycomb]
    C --> H[MCP Server]
    D --> H
    H -->|tools & resources| A
stakeout-agent hooks into your framework's event system. It records a run document for each invocation and an event document for every node start/end, tool call, tool result, and error — with latency, token usage, and the actual prompts and responses captured at every step. The optional MCP server feeds that history back to your agents as callable tools, closing the loop between monitoring and reasoning.
Why stakeout-agent?
| stakeout-agent | |
|---|---|
| Lines of integration code | 3 |
| Crashes your app on DB failure | Never — errors are logged, not raised |
| Node-level latency (P95) | Yes — tracked per node and per tool |
| Token usage | Yes — per node and rolled up to the run |
| Cost estimation | Yes — opt-in, configurable per model |
| Prompt & response capture | Yes — per node, opt-out, truncation supported |
| Non-blocking writes | Yes — opt-in BufferedWriter keeps DB I/O off the LLM hot path |
| Sliding-window alerting | Yes — error rate, P95/P99 latency, cost; webhook to Slack, PagerDuty, etc. |
| Data retention / TTL | Yes — configurable per environment or graph; MongoDB TTL index, Postgres sweep CLI |
| MCP server | Yes — agents query their own run history at runtime via standard MCP tools |
| Frameworks | LangGraph + CrewAI |
| Backends | MongoDB + PostgreSQL + OpenTelemetry |
| Dashboard included | Yes — dedicated real-time observability UI |
Installation
Install only what you need — framework and backend are independent extras:
# LangGraph + MongoDB
pip install 'stakeout-agent[langgraph,mongodb]'

# LangGraph + PostgreSQL
pip install 'stakeout-agent[langgraph,postgres]'

# LangGraph + OpenTelemetry (Jaeger, Datadog, Grafana Tempo, Honeycomb, …)
pip install 'stakeout-agent[langgraph,otel]'

# CrewAI + MongoDB
pip install 'stakeout-agent[crewai,mongodb]'

# CrewAI + PostgreSQL
pip install 'stakeout-agent[crewai,postgres]'

# CrewAI + OpenTelemetry
pip install 'stakeout-agent[crewai,otel]'
| Extra | Installs | Use when |
|---|---|---|
langgraph |
langchain-core, langgraph |
Using LangGraph |
crewai |
crewai |
Using CrewAI |
mongodb |
pymongo |
Storing to MongoDB |
postgres |
psycopg2-binary, alembic, sqlalchemy |
Storing to PostgreSQL |
otel |
opentelemetry-sdk, opentelemetry-exporter-otlp-proto-grpc |
Exporting to any OTEL-compatible collector |
mcp |
mcp, uvicorn |
Running the MCP server so agents can query run history |
Requires Python 3.10+.
Quick start
LangGraph — Sync
from stakeout_agent import LangGraphMonitorCallback

monitor = LangGraphMonitorCallback(graph_id="my_graph", thread_id="thread_123")
result = graph.invoke(inputs, config={"callbacks": [monitor]})
LangGraph — Async
from stakeout_agent import AsyncLangGraphMonitorCallback

monitor = AsyncLangGraphMonitorCallback(graph_id="my_graph", thread_id="thread_123")
result = await graph.ainvoke(inputs, config={"callbacks": [monitor]})
CrewAI — Sync
from stakeout_agent import CrewAIMonitorCallback

monitor = CrewAIMonitorCallback(crew_id="my_crew", thread_id="thread_123")
crew.kickoff(inputs={...})
CrewAIMonitorCallback registers itself with CrewAI's event bus automatically — no extra wiring needed.
CrewAI — Async
from stakeout_agent import AsyncCrewAIMonitorCallback

monitor = AsyncCrewAIMonitorCallback(crew_id="my_crew", thread_id="thread_123")
await crew.akickoff(inputs={...})
Concurrent invocations
LangGraph — a single callback instance is safe to share across concurrent graph.invoke() / graph.ainvoke() calls. Per-run state is keyed internally by the root run UUID, so two simultaneous invocations never interfere with each other:
# Fine — one shared instance, both runs tracked independently
monitor = AsyncLangGraphMonitorCallback(graph_id="g", thread_id="t")
await asyncio.gather(
    graph.ainvoke(inputs_a, config={"callbacks": [monitor]}),
    graph.ainvoke(inputs_b, config={"callbacks": [monitor]}),
)
CrewAI — use a separate instance per concurrent kickoff. CrewAI's event bus is global and does not carry a run identifier, so events from two simultaneous crews on the same listener cannot be reliably routed:
# Correct — separate instance per concurrent kickoff
await asyncio.gather(
    crew.akickoff(inputs_a),   # monitor_a registered with crew_a
    crew.akickoff(inputs_b),   # monitor_b registered with crew_b
)
Token usage and cost tracking
Token counts are captured automatically from every LLM call — no changes to your agent code required. Per-node input/output tokens are recorded on each node_end event, and totals are rolled up onto the run document at completion.
Token capture only (always on)
from stakeout_agent import LangGraphMonitorCallback

monitor = LangGraphMonitorCallback(graph_id="my_graph", thread_id="thread_123")
result = graph.invoke(inputs, config={"callbacks": [monitor]})
Token fields (input_tokens, output_tokens, model) appear on node_end events and total_input_tokens / total_output_tokens on the run document whenever the LLM response contains usage metadata.
Cache token fields (cache_read_tokens, cache_creation_tokens) are captured automatically for providers that report them — Anthropic (prompt caching) and OpenAI (cached inputs). They appear on node_end events and roll up as total_cache_read_tokens / total_cache_creation_tokens on the run document.
Cost estimation (opt-in)
from stakeout_agent import LangGraphMonitorCallback
from stakeout_agent.pricing import ModelPricing, PricingMap

monitor = LangGraphMonitorCallback(
    graph_id="my_graph",
    thread_id="thread_123",
    pricing=PricingMap({
        "gpt-4o":      ModelPricing(input_cost_per_1k=0.005,   output_cost_per_1k=0.015),
        "gpt-4o-mini": ModelPricing(input_cost_per_1k=0.00015, output_cost_per_1k=0.0006),
    })
)
result = graph.invoke(inputs, config={"callbacks": [monitor]})
When pricing is provided, estimated_cost_usd is computed per LLM call and rolled up onto the run. Multi-model workflows are fully supported — each node resolves cost against the model it actually used. Models not present in the map are silently skipped; token counts are still recorded.
Custom token extractor
The default extractor covers OpenAI (token_usage / model_name) and Anthropic (usage / model) response shapes. For providers with a different metadata structure, pass a token_extractor:
def my_extractor(metadata: dict) -> tuple[int | None, int | None, str | None]:
    usage = metadata.get("llm_output", {}).get("token_usage", {})
    return usage.get("input"), usage.get("output"), metadata.get("model_id")

monitor = LangGraphMonitorCallback(
    graph_id="my_graph",
    thread_id="thread_123",
    token_extractor=my_extractor,
)
The extractor receives response.llm_output and must return (input_tokens, output_tokens, model_name). Any field can be None.
Prompt and response capture
The exact messages sent to the LLM and the response text are captured automatically on each node_end event. This is on by default and requires no configuration.
from stakeout_agent import LangGraphMonitorCallback

monitor = LangGraphMonitorCallback(graph_id="my_graph", thread_id="thread_123")
result = graph.invoke(inputs, config={"callbacks": [monitor]})
Each node_end event will include:
{
  "event_type": "node_end",
  "node_name": "agent",
  "llm_input": [
    { "role": "system", "content": "You are a helpful assistant." },
    { "role": "user",   "content": "Summarize the following document..." }
  ],
  "llm_output": "Here is a concise summary..."
}
llm_input and llm_output are absent when no LLM call occurred within the node (e.g. pure routing nodes).
Opt out for sensitive workloads
monitor = LangGraphMonitorCallback(
    graph_id="my_graph",
    thread_id="thread_123",
    capture_payloads=False,
)
Recommended for regulated or privacy-sensitive environments (financial services, healthcare) where prompt content may include PII or confidential data.
Limit stored content size
monitor = LangGraphMonitorCallback(
    graph_id="my_graph",
    thread_id="thread_123",
    max_payload_chars=2000,
)
Each message's content and the response text are truncated to max_payload_chars characters before storage. Useful for long-context or multi-turn workflows to prevent unbounded document sizes.
Both options apply identically to AsyncLangGraphMonitorCallback, CrewAIMonitorCallback, and AsyncCrewAIMonitorCallback.
Run inputs, multi-agent linking, and prompt versioning
Three optional constructor parameters extend what is stored on the run document. All three are framework-agnostic and work identically on LangGraphMonitorCallback, AsyncLangGraphMonitorCallback, CrewAIMonitorCallback, and AsyncCrewAIMonitorCallback.
Capture run inputs
The initial inputs to graph.invoke() / crew.kickoff() are stored on the run document as run_inputs. This lets you replay, diff, and regression-test runs against their original inputs.
monitor = LangGraphMonitorCallback(graph_id="my_graph", thread_id="thread_123")
graph.invoke({"query": "Summarise Q1 results"}, config={"callbacks": [monitor]})
# → run document includes run_inputs: '{"query": "Summarise Q1 results"}'
Capture is on by default when capture_payloads=True (the default). Set capture_payloads=False to suppress it, or max_payload_chars=N to cap the serialised size.
Multi-agent run linking
When one agent invokes another, each produces a separate run with no connection by default. Pass parent_run_id to link child runs back to their parent:
# Parent agent — record the root run id
parent_monitor = LangGraphMonitorCallback(graph_id="orchestrator", thread_id="session_1")
result = parent_graph.invoke(inputs, config={"callbacks": [parent_monitor]})
parent_run_id = list(parent_monitor._active_runs.keys())[0]  # or pass via state

# Child agent — link to the parent
child_monitor = LangGraphMonitorCallback(
    graph_id="researcher",
    thread_id="session_1",
    parent_run_id=parent_run_id,
)
child_graph.invoke(sub_inputs, config={"callbacks": [child_monitor]})
Both runs are stored independently. parent_run_id on the child run document is the only linkage — query the full tree by following parent_run_id references.
Prompt version tagging
Tag every run with the prompt version in use. This lets you correlate quality or cost changes to specific prompt changes without any extra infrastructure:
monitor = LangGraphMonitorCallback(
    graph_id="my_graph",
    thread_id="thread_123",
    prompt_version="v2.1",
)
Filter or group runs by prompt_version to compare latency, token usage, and error rates across prompt iterations:
MongoDB:
db.runs.aggregate([
    {"$group": {
        "_id": "$prompt_version",
        "avg_tokens": {"$avg": "$total_input_tokens"},
        "error_count": {"$sum": {"$cond": [{"$eq": ["$status", "failed"]}, 1, 0]}},
    }}
])
PostgreSQL:
SELECT prompt_version,
       AVG(total_input_tokens) AS avg_input_tokens,
       COUNT(*) FILTER (WHERE status = 'failed') AS error_count
FROM runs
GROUP BY prompt_version;
Dashboard
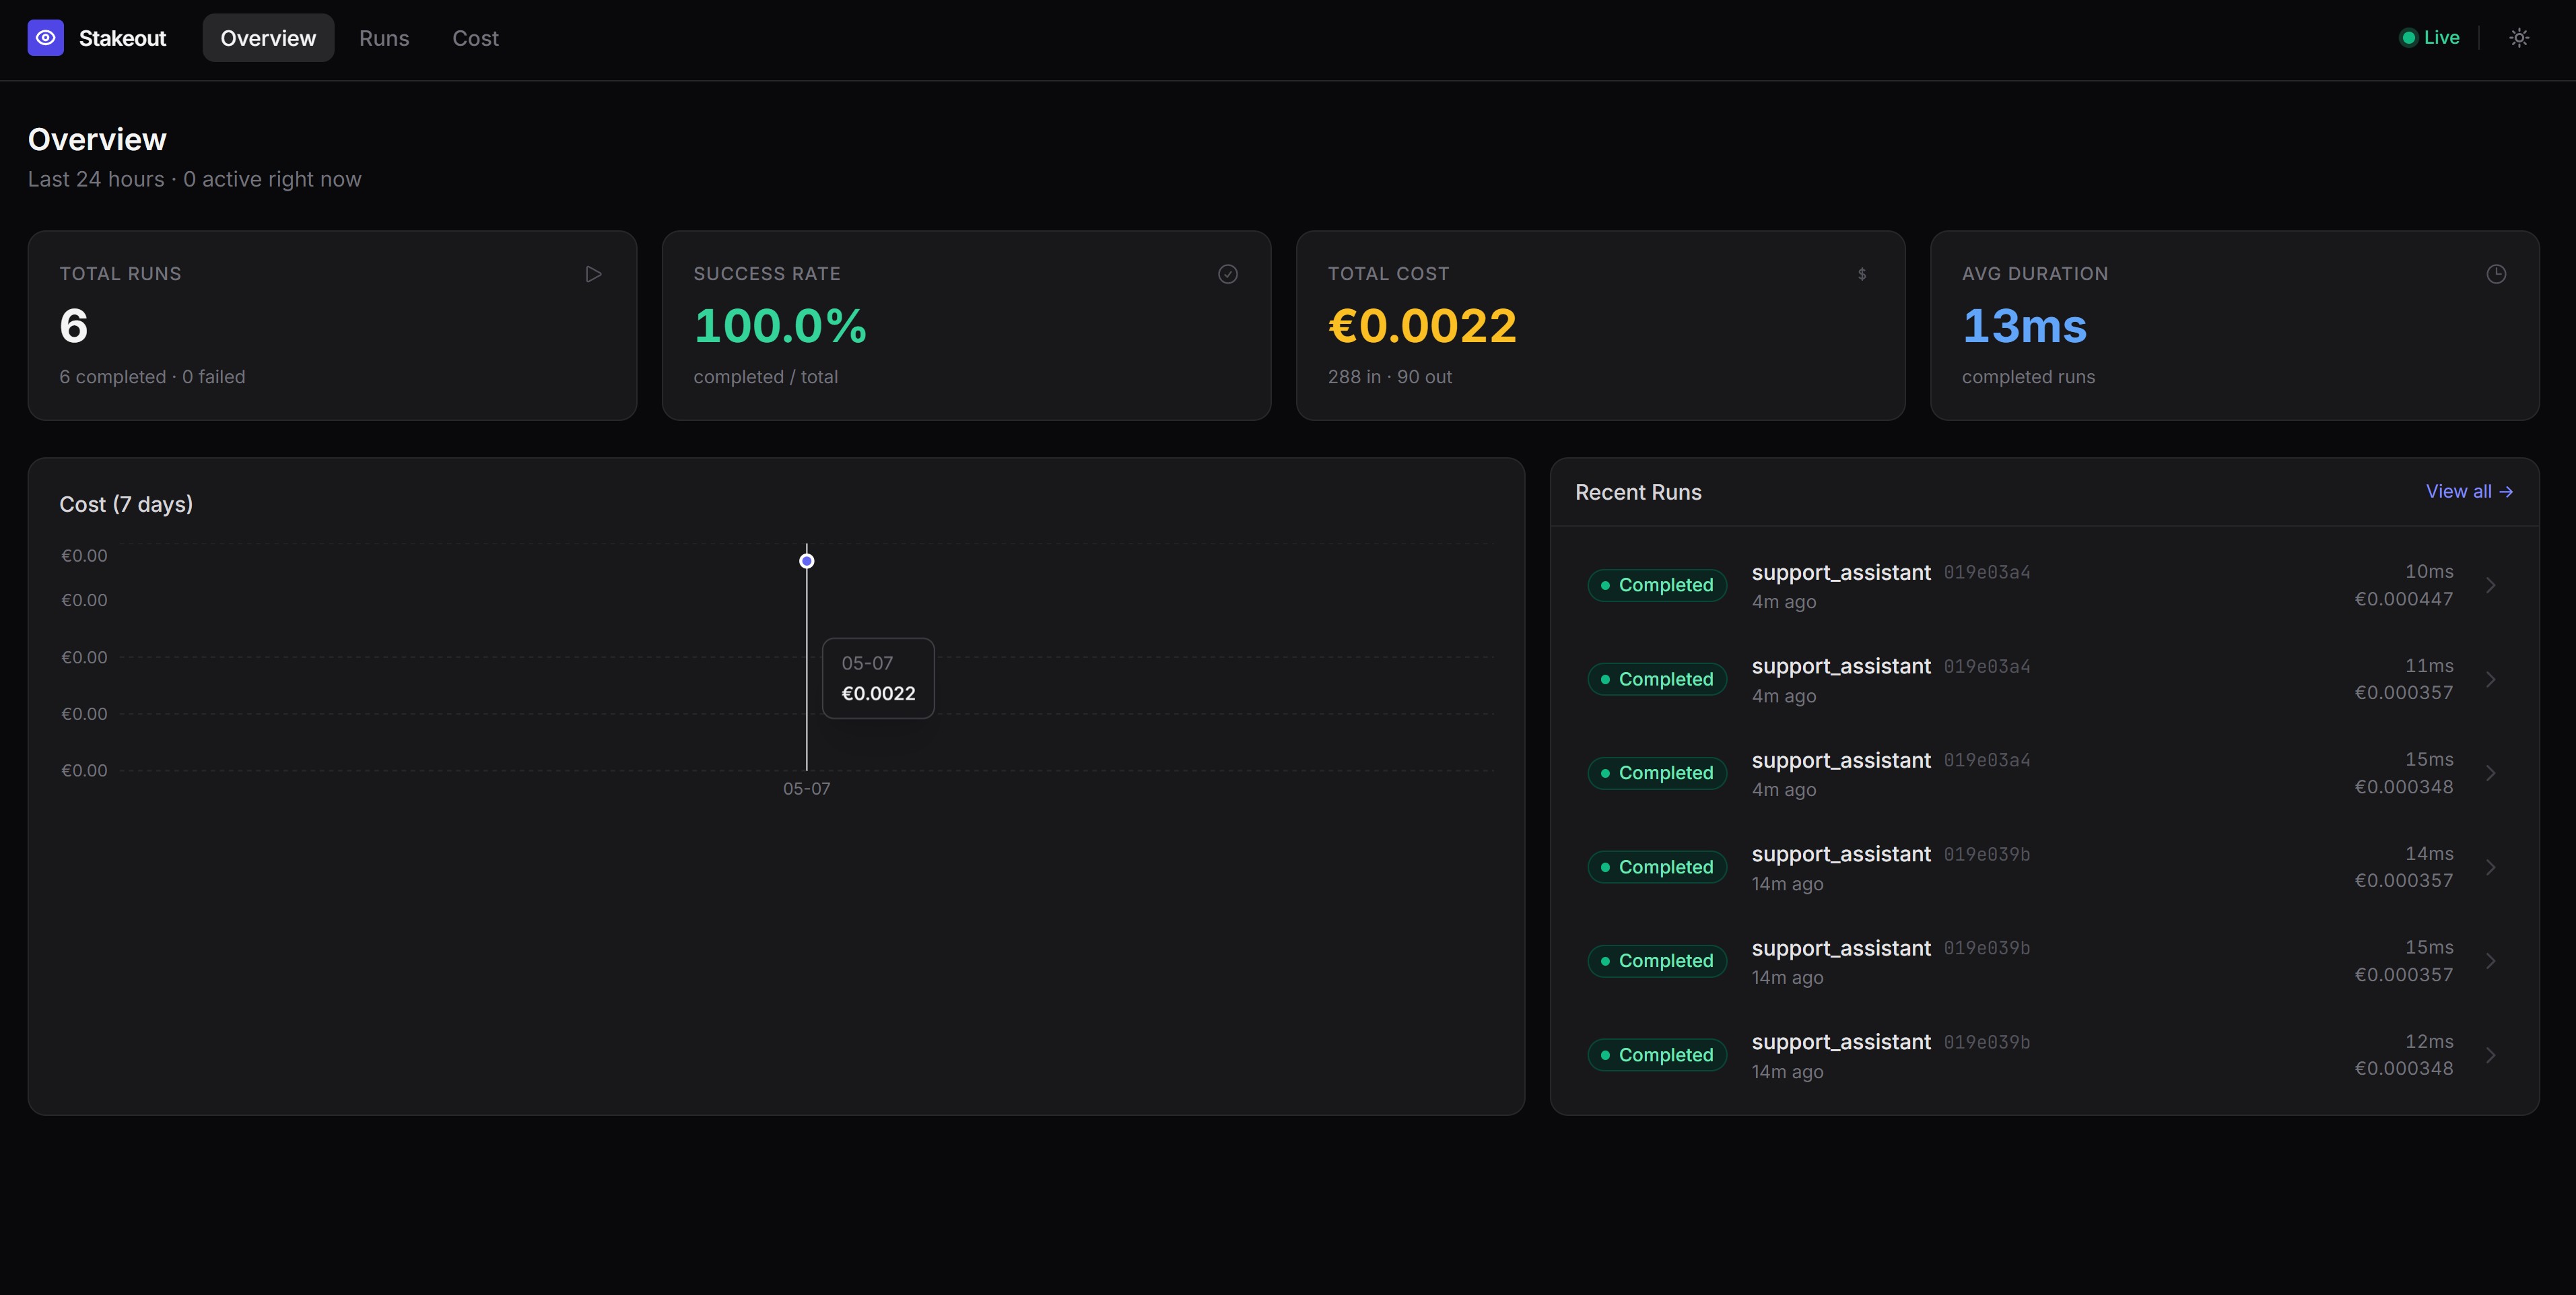
A dedicated dashboard repository is available at stakeout-dashboard — a standalone Streamlit app that connects to your MongoDB or PostgreSQL backend and visualises everything stakeout-agent captures.
The dashboard shows:
- Run History — recent runs, status, duration, and a runs-over-time chart
- Node Performance — average and P95 latency per node and tool, error counts
- Run Inspector — full event timeline for any individual run
- Thread Deep Dive — multi-turn conversation view across all runs in a thread
See the stakeout-dashboard README for setup and configuration instructions.
Try the examples
LangGraph
A self-contained example that requires no LLM API key — nodes are pure Python functions.
docker compose up -d mongo
cd stakeout-agent
uv run --extra langgraph --extra mongodb python examples/dummy_app.py
CrewAI
Requires a running MongoDB instance and an OpenAI API key (or configure a different provider via the llm parameter on each Agent).
Sync:
docker compose up -d mongo
cd stakeout-agent
OPENAI_API_KEY=sk-... uv run --extra crewai --extra mongodb python examples/dummy_crewai_app.py
Async:
docker compose up -d mongo
cd stakeout-agent
OPENAI_API_KEY=sk-... uv run --extra crewai --extra mongodb python examples/dummy_crewai_async_app.py
Each example runs a two-agent crew (Researcher + Writer) with a MultiplyTool, then prints the runs and events documents written to MongoDB.
Configuration
| Environment variable | Default | Description |
|---|---|---|
STAKEOUT_BACKEND |
mongodb |
Backend to use: mongodb or postgres |
MONGO_URI |
mongodb://localhost:27017 |
MongoDB connection string |
MONGO_DB |
stakeout |
MongoDB database name |
POSTGRES_URI |
postgresql://localhost/stakeout |
PostgreSQL connection string (also reads DATABASE_URL) |
OTEL_EXPORTER_OTLP_ENDPOINT |
— | OTLP collector endpoint; triggers auto-configure when set |
OTEL_EXPORTER_OTLP_HEADERS |
— | Headers for the OTLP exporter (e.g. auth tokens) |
OTEL_SERVICE_NAME |
stakeout-agent |
Service name attached to all spans |
STAKEOUT_DLQ_PATH |
stakeout_dlq.jsonl |
Path for the BufferedWriter dead-letter queue file |
STAKEOUT_RETENTION_DEFAULT_DAYS |
— | Default TTL in days for all runs; unset disables retention |
STAKEOUT_RETENTION_DEV_DAYS |
— | TTL override for runs tagged environment="dev" |
STAKEOUT_RETENTION_STAGING_DAYS |
— | TTL override for runs tagged environment="staging" |
PostgreSQL
export STAKEOUT_BACKEND=postgres
export POSTGRES_URI=postgresql://user:password@localhost/stakeout
Schema migrations are managed with Alembic and run automatically on first connection. Versioned migration files live under stakeout_agent/backends/migrations/versions/ — each schema change is a numbered revision with upgrade() and downgrade(). Alembic records applied revisions in an alembic_version table, so only new migrations run on reconnect. To add a column, create a new revision rather than appending an ALTER TABLE to shared SQL.
docker compose up -d postgres
# connection string: postgresql://stakeout:stakeout@localhost/stakeout
You can also inject a backend instance directly:
from stakeout_agent import LangGraphMonitorCallback, PostgresMonitorDB

monitor = LangGraphMonitorCallback(
    graph_id="my_graph",
    thread_id="thread_123",
    db=PostgresMonitorDB(),
)
OpenTelemetry
Export every run and node as an OTEL trace to any compatible collector — Jaeger, Datadog, Grafana Tempo, Honeycomb, and others — without changing your agent code.
pip install 'stakeout-agent[langgraph,otel]'
export OTEL_EXPORTER_OTLP_ENDPOINT=http://localhost:4317
export OTEL_SERVICE_NAME=my-agent-service   # optional, defaults to "stakeout-agent"
from stakeout_agent import LangGraphMonitorCallback
from stakeout_agent.backends.otel import OTELMonitorDB

monitor = LangGraphMonitorCallback(
    graph_id="my_graph",
    thread_id="thread_123",
    db=OTELMonitorDB(),  # reads OTEL_EXPORTER_OTLP_ENDPOINT automatically
)
result = graph.invoke(inputs, config={"callbacks": [monitor]})
OTELMonitorDB honours the standard OTEL environment variables (OTEL_EXPORTER_OTLP_ENDPOINT, OTEL_EXPORTER_OTLP_HEADERS, OTEL_SERVICE_NAME) so it drops into any existing OTEL setup with zero custom config.
For teams with a programmatic OTEL setup, inject your own TracerProvider:
from stakeout_agent.backends.otel import OTELMonitorDB

monitor = LangGraphMonitorCallback(
    graph_id="my_graph",
    thread_id="thread_123",
    db=OTELMonitorDB(tracer_provider=my_provider),
)
If neither OTEL_EXPORTER_OTLP_ENDPOINT nor an explicit provider is given, OTELMonitorDB falls back to the global OTEL tracer provider configured elsewhere in your application.
Span structure
Each invocation produces a trace following OpenTelemetry GenAI semantic conventions:
| stakeout concept | OTEL span |
|---|---|
run |
Root span — name is graph_id |
node_start / node_end |
Child span per node — name is the node name |
tool_call / tool_result |
Child span per tool call — name is the tool name |
retriever_start / retriever_end |
Child span per retriever call |
error |
StatusCode.ERROR + recorded exception on the relevant span |
latency_ms |
stakeout.latency_ms attribute (span duration also captures wall time) |
model |
gen_ai.request.model |
input_tokens / output_tokens |
gen_ai.usage.input_tokens / gen_ai.usage.output_tokens |
cache_read_tokens / cache_creation_tokens |
gen_ai.usage.cache_read_input_tokens / gen_ai.usage.cache_creation_input_tokens |
estimated_cost_usd |
stakeout.cost_usd |
llm_input / llm_output |
Span events gen_ai.content.prompt / gen_ai.content.completion (not attributes, to avoid collector size limits) |
thread_id, graph_id, run_id |
stakeout.thread_id, stakeout.graph_id, stakeout.run_id on root span |
run_inputs |
stakeout.run_inputs on root span |
parent_run_id |
stakeout.parent_run_id on root span |
prompt_version |
stakeout.prompt_version on root span |
What gets recorded
runs
One document per graph/crew invocation.
{
  "_id": "<run_id>",
  "graph_id": "my_graph",
  "thread_id": "thread_123",
  "status": "completed",
  "started_at": "2026-04-25T10:00:00Z",
  "ended_at": "2026-04-25T10:00:05Z",
  "error": null,
  "run_inputs": "{\"query\": \"Summarise Q1 results\"}",
  "parent_run_id": null,
  "prompt_version": "v2.1",
  "total_input_tokens": 1850,
  "total_output_tokens": 420,
  "estimated_cost_usd": 0.01553,
  "total_cache_read_tokens": 1200,
  "total_cache_creation_tokens": 650
}
status is one of running, completed, or failed. Token and cost fields are omitted when no LLM usage data is available; estimated_cost_usd is omitted when no pricing map is configured. run_inputs, parent_run_id, and prompt_version are omitted when not provided or when capture_payloads=False.
events
One document per node/task start/end, tool call, or error.
{
  "run_id": "<run_id>",
  "graph_id": "my_graph",
  "event_type": "node_end",
  "node_name": "agent",
  "timestamp": "2026-04-25T10:00:03Z",
  "latency_ms": 1240.5,
  "input_tokens": 320,
  "output_tokens": 85,
  "model": "gpt-4o",
  "llm_input": [
    {"role": "system", "content": "You are a helpful assistant."},
    {"role": "user", "content": "Summarize the following document..."}
  ],
  "llm_output": "Here is a concise summary...",
  "payload": {"outputs": "..."},
  "error": null
}
event_type |
When | latency_ms |
token fields | llm_input / llm_output |
|---|---|---|---|---|
node_start |
A graph node or crew task begins | absent | absent | absent |
node_end |
A graph node or crew task completes | present | present when LLM was called | present when LLM was called and capture_payloads=True |
tool_call |
A tool is invoked | absent | absent | absent |
tool_result |
A tool returns a result | present | absent | absent |
retriever_start |
A LangChain retriever starts (RAG) | absent | absent | absent |
retriever_end |
A retriever returns documents | present | absent | absent |
error |
A node, task, tool, or retriever raises an exception | present | absent | absent |
Error handling
All database writes catch exceptions and log them — a monitoring failure will never crash your application. Enable DEBUG logging to see them:
import logging
logging.getLogger("stakeout_agent").setLevel(logging.DEBUG)
Non-blocking writes (BufferedWriter)
By default, database writes happen synchronously on the LLM hot path. A network blip or a slow MongoDB write adds directly to the latency your users experience. BufferedWriter decouples persistence from the callback: all writes are enqueued in memory and executed by a background thread, so the LLM call returns immediately.
from stakeout_agent import LangGraphMonitorCallback, MongoMonitorDB, BufferedWriter

cb = LangGraphMonitorCallback(
    graph_id="my-graph",
    thread_id="t1",
    db=BufferedWriter(
        backend=MongoMonitorDB(),
        max_queue_size=10_000,          # in-memory queue depth (default: 10 000)
        max_retries=3,                  # retries per write with exponential backoff (default: 3)
        dlq_path="stakeout_dlq.jsonl",  # or set STAKEOUT_DLQ_PATH env var
    )
)
BufferedWriter wraps any AbstractMonitorDB and is itself an AbstractMonitorDB, so it slots into the existing db= parameter with no other changes. It works with all callback variants — LangGraphMonitorCallback, AsyncLangGraphMonitorCallback, CrewAIMonitorCallback, and AsyncCrewAIMonitorCallback.
Retry and dead-letter queue
Failed writes are retried up to max_retries times with exponential backoff (0.5 s, 1 s, 2 s, …). Writes that exhaust all retries are appended to a dead-letter queue (DLQ) file as newline-delimited JSON — never silently dropped. Each DLQ entry contains the original method, arguments, error message, and timestamp for replay or alerting.
{"timestamp": "2026-05-15T10:00:00Z", "method": "insert_event", "args": ["run-1", "my_graph", "node_end", "agent"], "kwargs": {...}, "error": "ConnectionRefusedError: [Errno 111] Connection refused"}
Set STAKEOUT_DLQ_PATH to control the file location (default: stakeout_dlq.jsonl in the working directory).
Graceful shutdown
Call close() — or use the context manager — to flush all pending writes before the process exits:
# Context manager — flushes on __exit__
with BufferedWriter(backend=MongoMonitorDB()) as writer:
    cb = LangGraphMonitorCallback(graph_id="g", thread_id="t", db=writer)
    result = graph.invoke(inputs, config={"callbacks": [cb]})

# Explicit close — when the writer outlives a single with block
writer = BufferedWriter(backend=MongoMonitorDB())
cb = LangGraphMonitorCallback(graph_id="g", thread_id="t", db=writer)
# ... run many graphs ...
writer.close()  # blocks until the queue is fully drained
The background worker is a daemon thread: the process can exit without calling close(), but any still-queued writes will be lost. Call close() when guaranteed delivery matters.
Observability
print(writer.dropped_events) # writes that went to DLQ or were dropped due to a full queue
Alerting
AlertManager evaluates sliding-window rules after every run completes and fires a webhook when a threshold is breached — with built-in cooldown to prevent alert floods. No extra dependencies; delivery uses the standard library urllib.request.
from stakeout_agent import LangGraphMonitorCallback, MongoMonitorDB
from stakeout_agent.alerts import AlertManager, Rule

alerts = AlertManager(
    rules=[
        Rule(metric="error_rate",        window_seconds=300,  threshold=0.05),  # >5% errors in 5 min
        Rule(metric="p95_latency_ms",    window_seconds=60,   threshold=10_000), # p95 > 10 s in 1 min
        Rule(metric="estimated_cost_usd",window_seconds=3600, threshold=5.0),   # >$5/hr
    ],
    webhook_url="https://hooks.slack.com/services/...",
    webhook_headers={"Authorization": "Bearer <token>"},  # optional — for PagerDuty etc.
    cooldown_seconds=300,  # fire each rule at most once per 5 minutes
)

cb = LangGraphMonitorCallback(
    graph_id="my-graph",
    thread_id="t1",
    db=MongoMonitorDB(),
    alert_manager=alerts,
)
result = graph.invoke(inputs, config={"callbacks": [cb]})
alert_manager= is accepted by all four callback variants: LangGraphMonitorCallback, AsyncLangGraphMonitorCallback, CrewAIMonitorCallback, and AsyncCrewAIMonitorCallback.
Built-in metrics
| Metric | Description |
|---|---|
error_rate |
Fraction of runs ending in failed status within the window |
p95_latency_ms |
95th-percentile run latency (ms) within the window |
p99_latency_ms |
99th-percentile run latency (ms) within the window |
estimated_cost_usd |
Sum of estimated_cost_usd across all runs within the window |
p95_latency_ms / p99_latency_ms require a pricing= map to be configured on the callback for estimated_cost_usd to be populated; latency is always tracked.
Webhook payload
The webhook fires a POST with Content-Type: application/json. The payload is compatible with Slack incoming webhooks and generic HTTP receivers:
{
  "alert": "error_rate",
  "value": 0.08,
  "threshold": 0.05,
  "window_seconds": 300,
  "graph_id": "my-graph",
  "fired_at": "2026-05-15T10:00:00Z"
}
Failure handling
Webhook delivery failures are logged at WARNING and never raised into the callback or affect run recording. A monitoring failure cannot crash your application.
Data retention
RetentionPolicy sets a TTL on every run at write time, so old data is deleted automatically — no cron job required for MongoDB, and a single CLI sweep handles PostgreSQL.
Why
Enterprises operating under GDPR, CCPA, or internal data governance policies need to demonstrate that data is not held beyond a stated period. Without retention, stakeout accumulates data indefinitely. Dev and staging environments also generate high volumes of low-value data that should expire far sooner than production.
Configure via env vars
STAKEOUT_RETENTION_DEFAULT_DAYS=90    # production
STAKEOUT_RETENTION_DEV_DAYS=7         # expires dev runs after 7 days
STAKEOUT_RETENTION_STAGING_DAYS=14    # expires staging runs after 14 days
Configure programmatically
from stakeout_agent import MongoMonitorDB, RetentionPolicy

policy = RetentionPolicy(
    default_days=90,
    overrides={
        "environment:dev": 7,
        "environment:staging": 14,
        "graph:experimental-agent": 30,
    },
)

db = MongoMonitorDB(retention=policy)
Pass retention=policy to MongoMonitorDB or PostgresMonitorDB. Setting retention=None (the default) preserves the original behaviour — data is never automatically deleted.
Override keys are matched in priority order: environment:<name> first, then graph:<id>, then default_days.
Tag runs with an environment
Pass environment= to the callback constructor so the policy can resolve the correct TTL:
monitor = LangGraphMonitorCallback(
    graph_id="my_graph",
    thread_id="thread_123",
    db=db,
    environment="staging",
)
How it works per backend
| Backend | Mechanism |
|---|---|
| MongoDB | A TTL index on runs.expires_at and events.expires_at is created on first connect (expireAfterSeconds=0). MongoDB's background reaper deletes expired documents automatically — no background thread or cron job needed. |
| PostgreSQL | expires_at is written on insert (migration 0005 adds the column). Run stakeout retention apply periodically (e.g. via cron or pg_cron) to delete expired rows. |
PostgreSQL: sweep expired rows
POSTGRES_URI=postgresql://user:pass@localhost/stakeout stakeout retention apply
# → retention apply: deleted 1 042 run(s) and 9 381 event(s).
Add this to a cron entry or pg_cron job to automate it.
Backfill existing data
Existing rows written before a retention policy was configured have no expires_at. Use backfill to set one retrospectively:
# PostgreSQL
POSTGRES_URI=... stakeout retention backfill --days 90

# MongoDB
MONGO_URI=... stakeout retention backfill --days 90
Both commands update only rows where expires_at is currently unset, so they are safe to run multiple times.
MCP server
The stakeout-agent[mcp] extra ships a Model Context Protocol server that exposes your run history as callable tools and browsable resources. Any MCP-aware agent — ChatGPT, Claude, a LangGraph agent with MCP tool nodes, AutoGen — can call these tools as part of its reasoning loop to detect repeated failures, surface cost metrics, or adjust its strategy based on what went wrong before.
This is a capability no existing monitoring library provides: trace data fed back to the agent at runtime, not just to a human dashboard.
Install
pip install 'stakeout-agent[mcp]'
The extra brings in mcp (the MCP Python SDK) and uvicorn for HTTP transports. You also need at least one storage backend:
pip install 'stakeout-agent[mcp,mongodb]'   # MongoDB
pip install 'stakeout-agent[mcp,postgres]'  # PostgreSQL
Start the server
The stakeout mcp CLI command is registered automatically when the package is installed. Point it at your backend via environment variables and choose a transport:
# stdio — for Claude Desktop, Claude Code, and local development
MONGO_URI=mongodb://localhost:27017 stakeout mcp --transport stdio

# SSE — for LangGraph agents and remote MCP clients
MONGO_URI=mongodb://localhost:27017 stakeout mcp --transport sse --host 127.0.0.1 --port 8001

# Streamable HTTP — for production deployments behind a reverse proxy
POSTGRES_URI=postgresql://user:pass@localhost/stakeout stakeout mcp --transport streamable-http --port 8001
The backend is auto-detected: MONGO_URI selects MongoDB; POSTGRES_URI or DATABASE_URL selects PostgreSQL. The server exits with a clear error if neither is set.
Optional bearer-token auth
Set STAKEOUT_MCP_TOKEN to require a bearer token on all SSE and streamable-HTTP requests. stdio transport is local-only and does not require auth.
MONGO_URI=mongodb://localhost:27017 STAKEOUT_MCP_TOKEN=mysecret stakeout mcp --transport sse --port 8001
Clients must then send Authorization: Bearer mysecret with every request.
Connect an agent
LangGraph agent (SSE)
from langchain_mcp_adapters.client import MultiServerMCPClient

client = MultiServerMCPClient({
    "stakeout": {
        "url": "http://127.0.0.1:8001/sse",
        "transport": "sse",
    }
})
tools = await client.get_tools()
# pass `tools` to your LangGraph agent's tool node
Exposed tools
| Tool | Description |
|---|---|
get_recent_runs |
Return the N most recent runs, optionally filtered by graph_id |
get_run_detail |
Return the full event trace for a specific run_id |
get_failed_runs |
Return failed runs within a time window, with error messages |
get_slow_runs |
Return runs that exceeded a latency threshold |
get_run_stats |
Aggregate stats: error rate, p50/p95 latency, total cost |
search_runs_by_output |
Case-insensitive search across captured run inputs |
All tools accept an optional graph_id parameter to scope results to a specific agent. Time windows are expressed in hours or days from the current moment so the agent does not need to know the current timestamp.
Exposed resources
Resources are browsable MCP content — clients can list and read them without making a tool call:
| URI | Content |
|---|---|
stakeout://runs |
JSON list of the 20 most recent runs across all graphs |
stakeout://runs/{run_id} |
Full trace (run document + all events) for a specific run |
stakeout://graphs/{graph_id}/stats |
Aggregate stats for a graph over the last 7 days |
Example: agent that avoids repeating failures
Agent: [calls get_failed_runs(graph_id="research-agent", last_n_hours=1)]
Tool:  [returns 3 failed runs, all failing at "web_search" node with "rate limit" error]
Agent: "I've hit rate limits 3 times in the last hour on web_search.
        I'll use the cached knowledge base instead."
Agent: [calls get_run_stats(graph_id="report-generator", last_n_days=7)]
Tool:  [returns avg_cost_usd=0.42, p95_latency_ms=12000, error_rate=0.03]
Agent: "This week's runs averaged $0.42 each and p95 latency is 12 s.
        Should I proceed with the full report or use the summary pipeline?"
A full working example is in examples/mcp_langgraph_example.py.
Threads and conversation history
What thread_id means
thread_id is a label you assign to group related invocations together — typically a user session or a multi-turn conversation. stakeout-agent stores it on every run but does not manage it:
thread_id          ← your conversation identifier (you supply this)
  └── run_id       ← one graph.invoke() / crew.kickoff() call (generated per execution)
        └── events ← node_start, node_end, tool_call, tool_result, error
Every time you call graph.invoke(...) with the same thread_id, a new run is created under that thread. The events for each run are stored in order of timestamp.
Viewing all steps in a conversation
To reconstruct the full execution history of a conversation, query runs by thread_id and then fetch events for each run in timestamp order.
MongoDB:
from stakeout_agent import MongoMonitorDB

db = MongoMonitorDB()

thread_id = "thread_123"

runs = list(db.runs.find({"thread_id": thread_id}).sort("started_at", 1))
for run in runs:
    print(f"\n--- Run {run['_id']} ({run['status']}) ---")
    events = list(db.events.find({"run_id": run["_id"]}).sort("timestamp", 1))
    for ev in events:
        print(f"  [{ev['timestamp']}] {ev['event_type']:12s}  node={ev['node_name']}")
PostgreSQL:
SELECT r.run_id, e.timestamp, e.event_type, e.node_name, e.latency_ms, e.error
FROM events e
JOIN runs r ON r.run_id = e.run_id
WHERE r.thread_id = 'thread_123'
ORDER BY e.timestamp ASC;
The stakeout-dashboard Thread Deep Dive view does exactly this — select any thread_id and see every run and every step in chronological order.
Integration tests
Integration tests run against real backend services and are kept separate from the unit test suite so CI stays fast and dependency-free. Unit tests (mocks only) always run. Integration tests require Docker and are run locally or in a dedicated CI job.
Test layout
| Path | Needs Docker | What it covers |
|---|---|---|
tests/ |
No | All unit tests — mocked at the driver boundary |
tests/integration/test_mongo_integration.py |
mongo |
Full CRUD lifecycle against a real MongoDB instance |
tests/integration/test_postgres_integration.py |
postgres |
Full CRUD lifecycle against a real PostgreSQL instance |
tests/integration/test_otel_inprocess.py |
No | OTEL backend with InMemorySpanExporter — span tree, attributes, events, error paths |
tests/integration/test_buffered_writer_integration.py |
mongo, postgres |
BufferedWriter lifecycle, concurrent writes, retry-and-recover, DLQ — against real backends |
The OTEL in-process tests use the SDK's InMemorySpanExporter and run without any container. MongoDB and Postgres tests auto-skip when the container isn't reachable, so a plain pytest never fails due to a missing service.
Start the backends
# from the repo root
docker compose up -d
Wait for the healthchecks to pass (about 10–15 seconds), then confirm all three are healthy:
docker compose ps
| Service | Port | Notes |
|---|---|---|
stakeout-mongo |
27017 |
MongoDB 7 |
stakeout-postgres |
5432 |
PostgreSQL 16 — user/pass/db: stakeout |
stakeout-jaeger |
4317 (OTLP gRPC), 16686 (UI) |
Jaeger all-in-one |
Run integration tests
cd stakeout-agent

# All backends at once
uv run --with pytest --extra langgraph --extra mongodb --extra postgres --extra crewai --extra otel pytest tests/integration -v

# One backend at a time
uv run --with pytest --extra mongodb pytest tests/integration/test_mongo_integration.py -v
uv run --with pytest --extra postgres pytest tests/integration/test_postgres_integration.py -v
uv run --with pytest --extra otel    pytest tests/integration/test_otel_inprocess.py -v
Run only unit tests (no Docker)
cd stakeout-agent
uv run --with pytest --extra langgraph --extra mongodb --extra postgres --extra crewai --extra otel pytest --ignore tests/integration
View OTEL traces in Jaeger
After running any code that uses OTELMonitorDB with OTEL_EXPORTER_OTLP_ENDPOINT=http://localhost:4317, open the Jaeger UI to browse traces:
http://localhost:16686
Select the stakeout-agent service (or whatever OTEL_SERVICE_NAME is set to) and explore the run timeline, node spans, tool calls, and token attributes.
Roadmap
- Sync LangGraph callback support
- Async LangGraph callback support
- Sync CrewAI callback support
- Async CrewAI callback support
- MongoDB persistence
- PostgreSQL persistence
- OpenTelemetry export (
OTELMonitorDB— Jaeger, Datadog, Grafana Tempo, Honeycomb, …) - Run and event collections
- Token usage tracking (per node and per run)
- Cost estimation with configurable pricing map
- Prompt and response capture per node (
capture_payloads,max_payload_chars) - Run input capture (
run_inputsstored on the run document) - Multi-agent run linking (
parent_run_idconstructor parameter) - Prompt version tagging (
prompt_versionconstructor parameter) - Non-blocking async buffered writes (
BufferedWriter— in-memory queue, exponential-backoff retry, dead-letter queue) - Sliding-window alerting (
AlertManager— error rate, P95/P99 latency, cost; webhook to Slack, PagerDuty, or any HTTP endpoint; per-rule cooldown) - Dedicated UI dashboard (Run History, Node Performance, Run Inspector, Thread Deep Dive)
- Configurable data retention / TTL (
RetentionPolicy— per environment or graph; MongoDB TTL index; Postgresstakeout retention applysweep) - Additional agentic frameworks (PydanticAI, SemanticKernel, AutoGen etc.)
- Additional storage backends (SQLite, Redis, …)
License
MIT
Project details
Verified details
These details have been verified by PyPIProject links
GitHub Statistics
Maintainers
Release history Release notifications | RSS feed


Download files
Download the file for your platform. If you're not sure which to choose, learn more about installing packages.
Source Distribution
Built Distribution
Filter files by name, interpreter, ABI, and platform.
If you're not sure about the file name format, learn more about wheel file names.
Copy a direct link to the current filters
File details
Details for the file stakeout_agent-0.2.2.tar.gz.
File metadata
- Download URL: stakeout_agent-0.2.2.tar.gz
- Upload date:
- Size: 82.8 kB
- Tags: Source
- Uploaded using Trusted Publishing? Yes
- Uploaded via: twine/6.1.0 CPython/3.13.12
File hashes
| Algorithm | Hash digest | |
|---|---|---|
| SHA256 |
7fa8ffefa83010eeb7ee09f9157a24237c1b9c891d2553d05e4e8d768437074d
|
|
| MD5 |
ae5583dfc09089508d69904dee83e837
|
|
| BLAKE2b-256 |
749db3192301025ee594a03c85d562d0d607e571110dbd8a21ae080cb27d6216
|
Provenance
The following attestation bundles were made for stakeout_agent-0.2.2.tar.gz:
Publisher:
python-publish.yml on KyriakosFrang/stakeout-agent
-
Statement:
-
Statement type:
https://in-toto.io/Statement/v1 -
Predicate type:
https://docs.pypi.org/attestations/publish/v1 -
Subject name:
stakeout_agent-0.2.2.tar.gz -
Subject digest:
7fa8ffefa83010eeb7ee09f9157a24237c1b9c891d2553d05e4e8d768437074d - Sigstore transparency entry: 1978324416
- Sigstore integration time:
-
Permalink:
KyriakosFrang/stakeout-agent@d39f93716394111666e68e2f53b6951c2be13f8d -
Branch / Tag:
refs/tags/v.0.2.2 - Owner: https://github.com/KyriakosFrang
-
Access:
public
-
Token Issuer:
https://token.actions.githubusercontent.com -
Runner Environment:
github-hosted -
Publication workflow:
python-publish.yml@d39f93716394111666e68e2f53b6951c2be13f8d -
Trigger Event:
release
-
Statement type:
File details
Details for the file stakeout_agent-0.2.2-py3-none-any.whl.
File metadata
- Download URL: stakeout_agent-0.2.2-py3-none-any.whl
- Upload date:
- Size: 52.9 kB
- Tags: Python 3
- Uploaded using Trusted Publishing? Yes
- Uploaded via: twine/6.1.0 CPython/3.13.12
File hashes
| Algorithm | Hash digest | |
|---|---|---|
| SHA256 |
57811ed7b19b97949c8965e97eba0412e172dc39b54c189d137c8d6bdc623f86
|
|
| MD5 |
41551e6646bc4054a9f5c9cdb5e167b2
|
|
| BLAKE2b-256 |
10e8cbe097f2f84ea4cc6d3bfc4c5982d78d6dfc29a4b8bd19fc696e5a7e93ed
|
Provenance
The following attestation bundles were made for stakeout_agent-0.2.2-py3-none-any.whl:
Publisher:
python-publish.yml on KyriakosFrang/stakeout-agent
-
Statement:
-
Statement type:
https://in-toto.io/Statement/v1 -
Predicate type:
https://docs.pypi.org/attestations/publish/v1 -
Subject name:
stakeout_agent-0.2.2-py3-none-any.whl -
Subject digest:
57811ed7b19b97949c8965e97eba0412e172dc39b54c189d137c8d6bdc623f86 - Sigstore transparency entry: 1978324510
- Sigstore integration time:
-
Permalink:
KyriakosFrang/stakeout-agent@d39f93716394111666e68e2f53b6951c2be13f8d -
Branch / Tag:
refs/tags/v.0.2.2 - Owner: https://github.com/KyriakosFrang
-
Access:
public
-
Token Issuer:
https://token.actions.githubusercontent.com -
Runner Environment:
github-hosted -
Publication workflow:
python-publish.yml@d39f93716394111666e68e2f53b6951c2be13f8d -
Trigger Event:
release
-
Statement type:






