

TCurve
A sleek progress bar tool
For better experience of printing on the terminal.




🚀 Spotlight
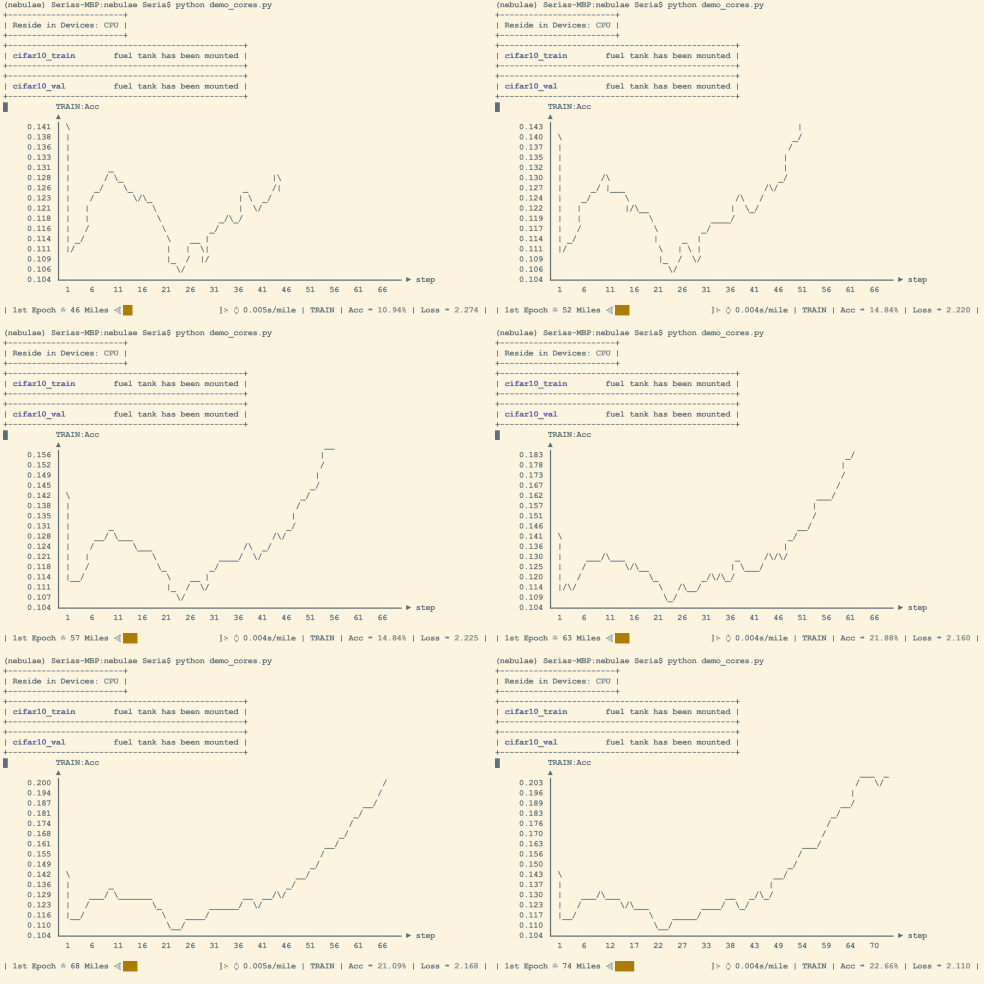
📈 Fascinating Dashboard
It shows visually appealing progress bars and draws metric based curves in real-time.
⚡ Quick Start
You can simply take it as a wrapper or help you plot curves.
import tcurve as tc
import time

# a simple wrapper
for i in tc.Dash(range(10)):
    time.sleep(0.5)

# wrap a generator
for i in tc.Dash(enumerate(range(30))):
    time.sleep(0.3)

# with keyword arguments
for i, n in tc.Dash(enumerate(range(30)), metrics={'number': ['d', tc.RAW]}, entry_fn=lambda idx, item: {'number': item[1]}, epoch=2, mpe=30, stage='COUNT', interv=1, wipe=False):
    time.sleep(0.3)

# in a complicated manner
tcd = tc.Dash(metrics={'Acc': ['.1f', tc.PERCENT]})
unit_acc = [0.012, 0.045, 0.134, 0.189, 0.234, 0.278, 0.345, 0.378, 0.456, 0.423, 0.51, 0.599, 0.623, 0.62, 0.7] # create a fake array for this tutorial
fake_acc = unit_acc + unit_acc[::-1] + unit_acc + unit_acc[::-1] + unit_acc + unit_acc[::-1]
for i, a in enumerate(fake_acc):
    time.sleep(0.1)
    tcd({'Acc': a}, 0, i, len(fake_acc))
The iterable wrapper accepts entry_fn(index, item) when an iterated value needs explicit mapping. For example:
for item in tc.Dash(
    enumerate(range(30)),
    metrics={'number': ['d', tc.RAW]},
    entry_fn=lambda index, item: {'number': item[1]},
):
    time.sleep(0.3)
Regular display updates default to interv=1 and refresh_interv=0.1 seconds. Set refresh_interv on Dash, or override it on an individual call. A positive interv enables the step condition; a positive refresh_interv enables the time condition. When both are enabled, both must pass. Zero or negative values disable that condition; disabling both raises an error.
dash = tc.Dash(metrics={'Loss': ['.3f', tc.RAW]}, refresh_interv=0.2)
for mile, loss in enumerate(losses):
    # Time-only display updates; statistics still include every call.
    dash({'Loss': loss}, 0, mile, len(losses), interv=0)
dash.finalize(review=False)
For step-only updates, set refresh_interv=0 and use a positive interv. With interv=10, refresh_interv=0.2, regular updates occur only at steps 10, 20, 30, ... and only if at least 0.2 seconds have elapsed since the last display update. The first frame, stage or epoch changes, epoch completion, end_epoch(), finalization with pending data, and keyboard actions refresh immediately. There is no background refresh thread: new updates require a call to Dash. Time throttling does not reduce user callback execution under the step rule or change per-step timing.
For a fixed mpe, epoch averages use the number of values actually reported for each metric. If a loop ends early, call end_epoch(stage=...) to close that stage's current epoch:
dash = tc.Dash(metrics={'Loss': ['.3f', tc.RAW]})
for mile, loss in enumerate(losses):
    dash({'Loss': loss}, epoch=0, mile=mile, mpe=len(losses), stage='TRAIN')
    if should_stop(loss):
        break
dash.end_epoch(stage='TRAIN')
dash.finalize(review=False)
Repeated end_epoch() calls are harmless, including after reaching mpe. An early summary is marked partial, such as partial 60/100. Starting a new epoch in the same stage or calling finalize() also closes unfinished epochs. Switching stages leaves each stage's epoch open independently. read() returns the current average even before an epoch ends.
The genre macros are listed below.
- RAW: display as it is
- PERCENT: shown as xx.yy% for example
- INVIZ: do not display but log to files
- IMAGE: to visualize the image using characters. usually collocated with lambda *x:1 (or lambda *x:0) to display on terminal (or not)
- CUSTOM: define your own function to process the content. the function is supposed to be like
def process_fn(value, epoch, mile, mpe, stage):
  # value: the loss/accuracy/generated image or anything else you get in this step
  # epoch: the current epoch
  # mile: the current step/iter within this epoch
  # mpe: how many steps/iters an epoch would go through
  # stage: the current stage, which is input by users

  # ----- do something here ----- #

  # return a string to display
🔥 Dive Deeper
Let's take the last example in previous part to show how could you use more arguments for delicate control.
# below is the common setting
unit_acc = [0.012, 0.045, 0.134, 0.189, 0.234, 0.278, 0.345, 0.378, 0.456, 0.423, 0.51, 0.599, 0.623, 0.62, 0.7] # create a fake array for this tutorial
flat_acc = [0.5, 0.5, 0.5, 0.5, 0.5, 0.5, 0.5, 0.5, 0.5, 0.5]
fake_acc = 10 * (unit_acc + unit_acc[::-1] + flat_acc)
We only take this for-loop to demonstrate. First, you can use is_global=True to plot the entire curve.
tcd = tc.Dash(metrics={'Acc': ['.1f', tc.PERCENT]})
for i, a in enumerate(fake_acc):
    time.sleep(0.1)
    tcd({'Acc': a}, 0, i, len(fake_acc), is_global=True)
Let is_global=False to view the recent changes of this curve.
tcd = tc.Dash(metrics={'Acc': ['.1f', tc.PERCENT]})
for i, a in enumerate(fake_acc):
    time.sleep(0.1)
    tcd({'Acc': a}, 0, i, len(fake_acc), is_global=False)
Make is_elastic=True to dynamically stretch or squeeze the vertical axis so that the fluctuation of curves is prominent enough to be observed.
tcd = tc.Dash(metrics={'Acc': ['.1f', tc.PERCENT]})
for i, a in enumerate(fake_acc):
    time.sleep(0.1)
    tcd({'Acc': a}, 0, i, len(fake_acc), is_elastic=True)
When you have several variables, set in_loop and last_for to switch among them.
e.g in_loop=(0, 1), last_for=5 means dashboard is going to show curves of var[0] and var[1] in turns. The displayed curve changes every 5 displayed updates, so time throttling does not skip metrics in the rotation.
tcd = tc.Dash(metrics={'Acc': ['.1f', tc.PERCENT], 'Level': ['.d', tc.RAW]})
for i, a in enumerate(fake_acc):
    time.sleep(0.1)
    tcd({'Acc': a, 'Level': i*i}, 0, i, len(fake_acc), in_loop=(0, 1), last_for=5)
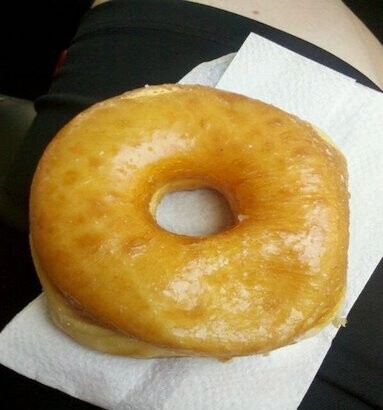
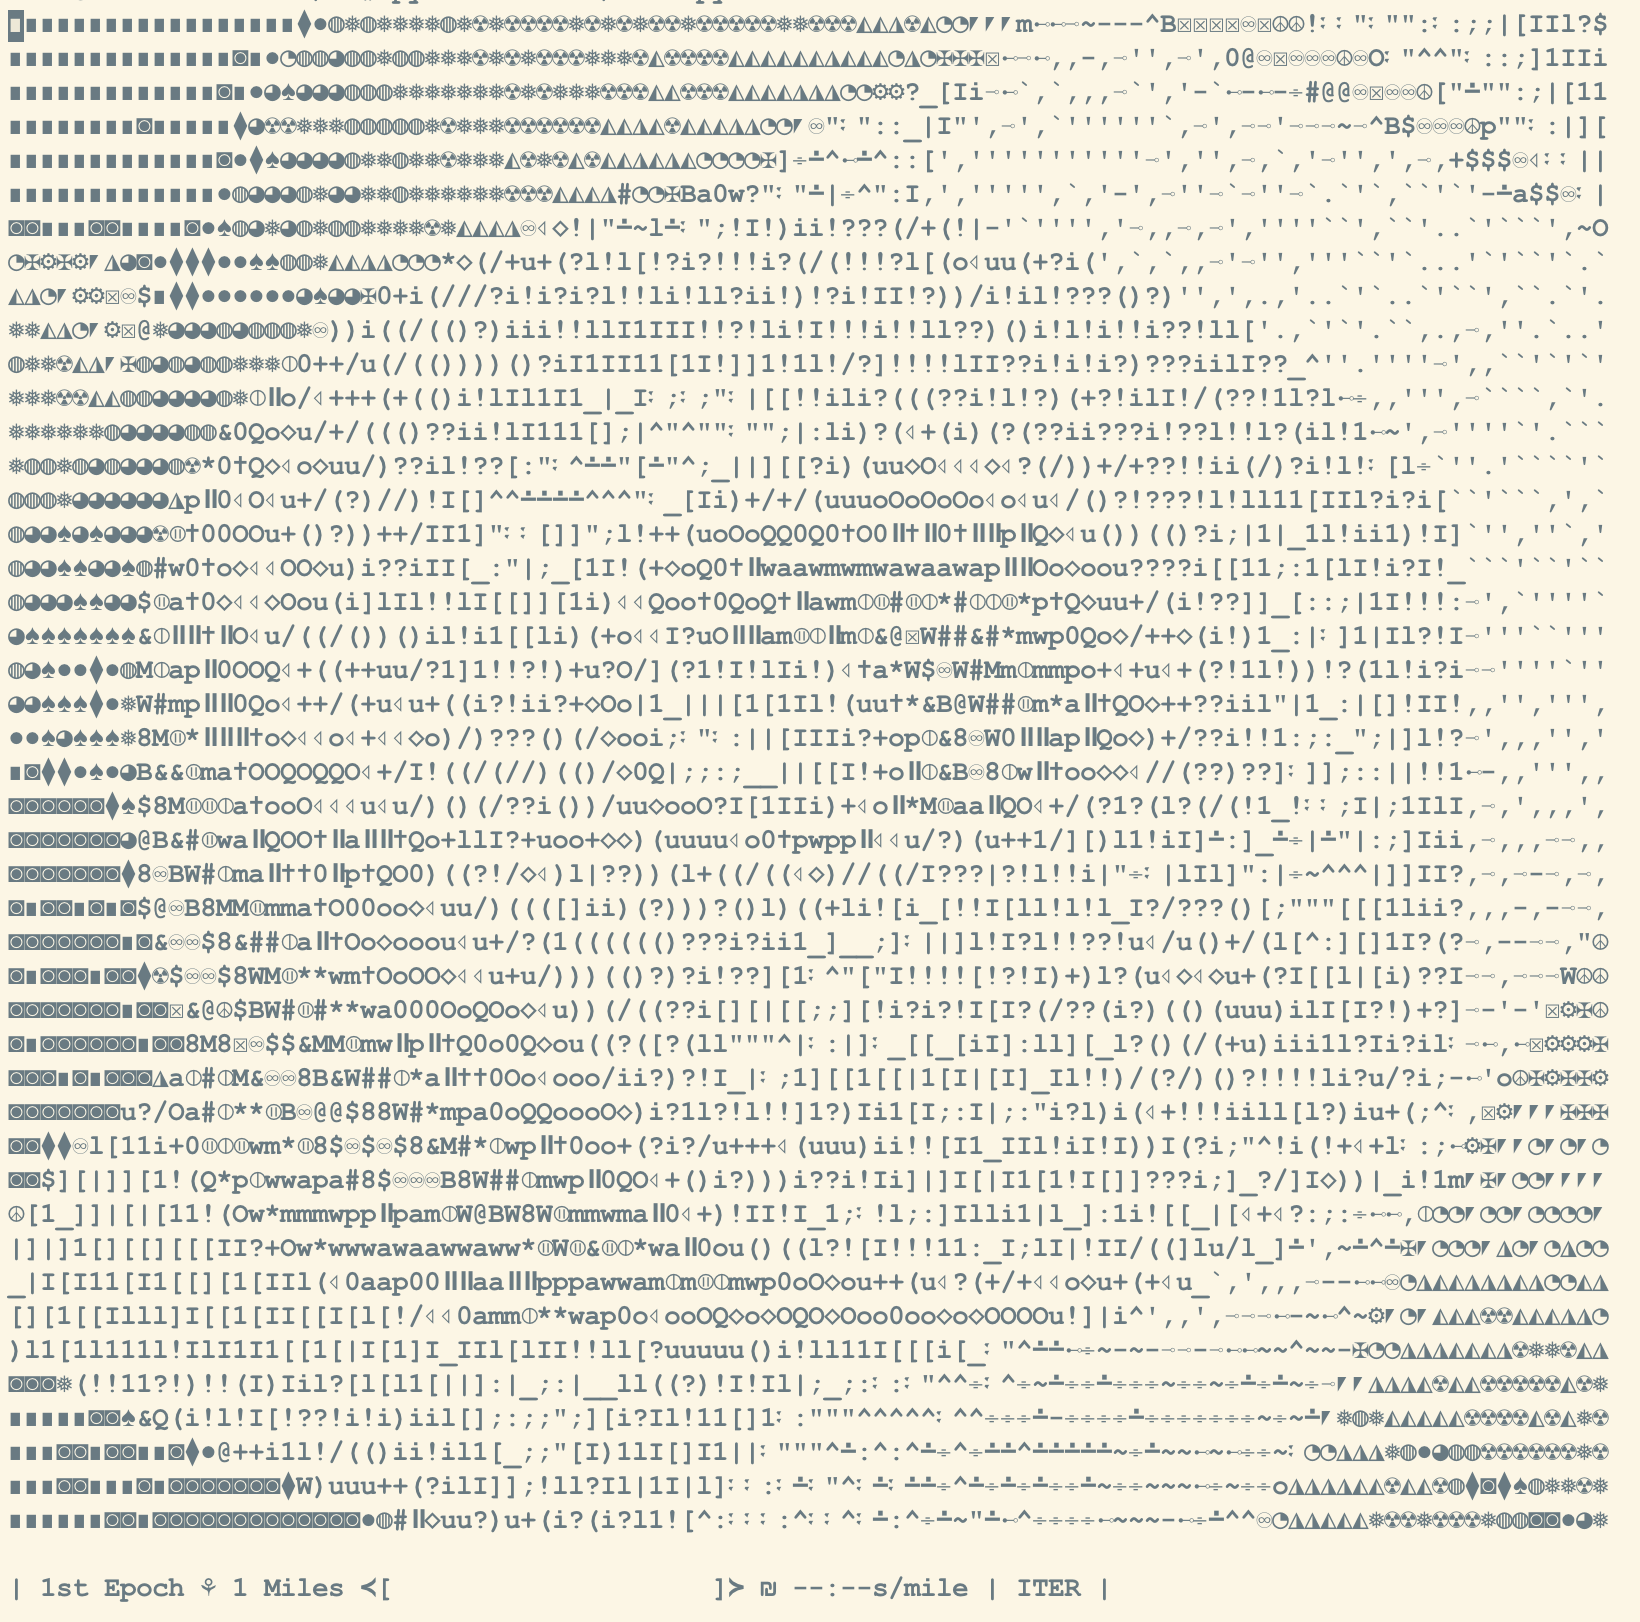
What's more, you can even draw the gray image on the terminal.
tcd = tc.Dash(metrics={'I': [lambda *x:1, tc.IMAGE]})
for i, img in enumerate(images):
    time.sleep(0.1)
    # read images here
    tcd({'I': img}, 0, i, len(images))
Try to squint at the right side. :D
🧭 Fullscreen Dashboard
TCurve starts in inline mode by default. In a large enough interactive terminal, press s to switch to fullscreen mode while the dashboard is running. Press s again to return to inline output.
Inline mode shows recent epoch summaries in chronological order above the current curve, image, view controls, and progress line. Older summaries are hidden when space is limited so the current display fits within the terminal.
When stdout is not a terminal, such as when redirected to a file or pipe, TCurve automatically writes plain-text completion summaries instead of a dynamic dashboard. Each completed epoch is written once, including partial epochs closed by end_epoch() or finalize(). For unknown mpe, finalize() writes the latest progress once. No terminal control sequences, character previews, or repeated frames are emitted, and summaries are not clipped to terminal width. Statistics and callbacks still run normally.
Fullscreen mode keeps the curve, epoch summaries, image preview, events, and help panel in a single screen. The common keys are:
s: switch between inline and fullscreen modej/kor up/down arrows: move between metrics or rows in the focused paneg: switch between global and recent curve viewe: switch between fixed and elastic y-axisv: split the curve view into left and right panesr: turn resource monitoring on or off when enabledl: show or hide the event paneli: show or hide the image panelt: collapse or expand the focused panetab: move focus between panes?: show or hide help:: open actionsq: exit review mode after a run finishes
Actions opened by : can prepend previous history, compare a previous run, export CSV files, or save curve plots. Use j / k or up/down arrows to choose an action, enter to select, p to type a path manually, and esc to close.
Split view is a two-pane comparison view. When there are more than two metrics, use tab to focus the left or right curve pane, then use j / k or up/down arrows to choose which metric that pane shows.
TCurve raises a clear error when span or divisor does not fit in the current terminal. Split view is also blocked when span is wider than half of the terminal, with the reason shown in the event panel.
Resource monitoring is opt-in. Set resources=True, switch to fullscreen mode, then press r to start or stop CPU, memory, and NVIDIA GPU sampling. Sampling is cached and remains off until r is pressed. The panel labels each value clearly, for example CPU Util, Memory, T.Celsius, and VRAM.
dash = tc.Dash(metrics={'Loss': ['.3f', tc.RAW]}, resources=True)
When you manually call Dash, use with or call finalize() after the loop in both inline and fullscreen modes. This restores the terminal and releases its dashboard ownership. The iterable wrapper handles this automatically when it is exhausted; use with or explicit finalization if you break out early.
After a fullscreen run finishes, finalize(review=True) keeps the final dashboard interactive until you press q. Use review=False to close it immediately.
finalize() stops keyboard monitoring and restores the terminal input mode. A force-killed process cannot run cleanup; if the terminal no longer echoes input after kill -9, run stty sane.
On POSIX systems, only one active Dash may use a terminal at a time. Ownership starts on first terminal use, remains held between updates and during fullscreen review, and is released after finalize() finishes. A second Dash using the same terminal raises an error before modifying the terminal. Separate terminals can run separate dashboards, and redirected output does not acquire terminal ownership.
For multiprocessing, display in the main process and send or aggregate worker metrics there. Each process keeps its own statistics; TCurve does not merge them. show=False skips statistics as well as display. Use separate log directories when processes export independently to avoid overwriting matching filenames. Create Dash inside the process that uses it; a fork-inherited Dash cannot be used in a child process.
# In the main process, after aggregating metrics from workers:
with tc.Dash(metrics={'Loss': ['.3f', tc.RAW]}) as dash:
    for mile, loss in enumerate(losses_from_workers):
        dash({'Loss': loss}, epoch=0, mile=mile, mpe=None, stage='TRAIN')
The operating system releases the terminal lock when its owning process exits, including after kill -9. This releases ownership but cannot restore terminal input mode after a force kill.
with tc.Dash(metrics={'Loss': ['.3f', tc.RAW]}, resources=True) as dash:
    for i, loss in enumerate(losses):
        dash({'Loss': loss}, 0, i, len(losses), stage='TRAIN')
🧾 Logs and History
By default, metric history is stored under ./logbook. You can change it with log_dir.
tcd = tc.Dash(log_dir='./logbook', metrics={'Loss': ['.3f', tc.RAW], 'Acc': ['.1f', tc.PERCENT]})
for i, (loss, acc) in enumerate([(1.2, 0.35), (0.8, 0.52), (0.4, 0.71)]):
    tcd({'Loss': loss, 'Acc': acc}, 0, i, 3, stage='TRAIN')

# Shortcut for plot_curves(subdir=...) + export_csv(subdir=...)
tcd.log(subdir='run_demo')
log(subdir='run_demo') saves both curve plots and CSV files under log_dir/run_demo. If you need only one kind of output, call plot_curves(subdir=...) or export_csv(subdir=...) directly.
plot_curves can choose exact curves with (stage, metric) pairs and group them with SERIES, METRIC, STAGE, or NOTHING. Non-scalar metrics such as IMAGE, INVIZ, and CUSTOM are not plotted.
Image export uses independent Matplotlib Agg canvases and works without a graphical display. No backend setup is required, and TCurve does not switch the application's Matplotlib backend or close its existing figures.
tcd.plot_curves(select=[('TRAIN', 'Loss')], group_by=tc.SERIES)
tcd.plot_curves(select=[('TRAIN', 'Loss'), ('VAL', 'Loss')], group_by=tc.METRIC)
tcd.plot_curves(select=[('TRAIN', 'Loss'), ('TRAIN', 'Acc')], group_by=tc.NOTHING)
CSV files are named by metric, stage, and unit, such as Loss_TRAIN_mile.csv and Loss_TRAIN_epoch.csv. Plot files are saved as .jpg.
You can load old CSV exports before or during a new run.
tcd = tc.Dash(metrics={'Loss': ['.3f', tc.RAW]})
tcd.prepend_history('./logbook/exports/run_demo')
tcd.compare_history('./logbook/exports/another_run')
prepend_history places old points before the current curve. compare_history overlays matching metrics from another run so the current trend can be compared in the terminal.
In fullscreen mode, press : to open actions for prepending history, comparing history, exporting CSV files, or saving plots without changing your training loop.
📦 Installation
TCurve supports Python 3.8+.
Install tcurve via pip
pip install tcurve
The following libs are installed as package dependencies.
- numpy
- pandas
- matplotlib
- seaborn
For terminal image preview, pass a 2D numpy array in float16, float32, or uint8.
Optional: install psutil for cross-platform CPU and memory usage. On Linux, TCurve can also read CPU and memory from /proc without psutil. NVIDIA GPU usage is read from nvidia-smi when available; driver/NVML errors are shown in the resource panel.
Optional: if you cloned the repository and want to run the unit tests locally, use:
python -m unittest discover -s unit_tests -p 'test_*.py'
❤️ Support
If you find TCurve helpful, please give it a ⭐ on GitHub! ▶️ https://github.com/SeriaQ/TCurve
1 maintainer

Metadata
1 maintainer
Release files for tcurve 0.3.0
For a detailed explanation of source distributions (sdists) and built distributions (wheels), please see the package formats documentation.
Source distribution (sdist)
| File | Size | Uploaded | |
|---|---|---|---|
| tcurve-0.3.0.tar.gz | 46.0 kB | Details |
Built distribution (wheel)
| File | Interpreter | ABI | Platform | Reset |
|---|---|---|---|---|
| tcurve-0.3.0-py3-none-any.whl | Python 3 | none | any | Details |
Total release size: 85.6 kB
Release files / tcurve-0.3.0.tar.gz
| Download URL | tcurve-0.3.0.tar.gz |
|---|---|
| Size | 46.0 kB |
| Tags | Source |
|
SHA-256 checksum How to use checksums |
a558fc0c0322a1559ed4e2287c017669ffe84554a147cf53518a06f36f6fe4ae
|
|
BLAKE2b-256 checksum How to use checksums |
d84ef85723f6552929cedf05955d6e3108c23e714ae5645db58614910a87408f
|
| Upload date | |
|
Uploaded using Trusted Publishing? What is trusted publishing? |
No |
| Uploaded via |
twine/6.1.0 CPython/3.10.12
|
Release files / tcurve-0.3.0-py3-none-any.whl
| Download URL | tcurve-0.3.0-py3-none-any.whl |
|---|---|
| Size | 39.6 kB |
| Tags | Python 3 |
|
SHA-256 checksum How to use checksums |
b6633276514b663e4c00cd99f395090e79e8af5c719f3ecbaaf7c62d156003b0
|
|
BLAKE2b-256 checksum How to use checksums |
6631fcd3eb71cc687470f4ec3bd354b22637a4dd2b9b8e09c40441143eed2380
|
| Upload date | |
|
Uploaded using Trusted Publishing? What is trusted publishing? |
No |
| Uploaded via |
twine/6.1.0 CPython/3.10.12
|














