
slurmwatch
Live, per-process CPU / memory / GPU telemetry for a running Slurm job — with a plain-language efficiency verdict.


Features
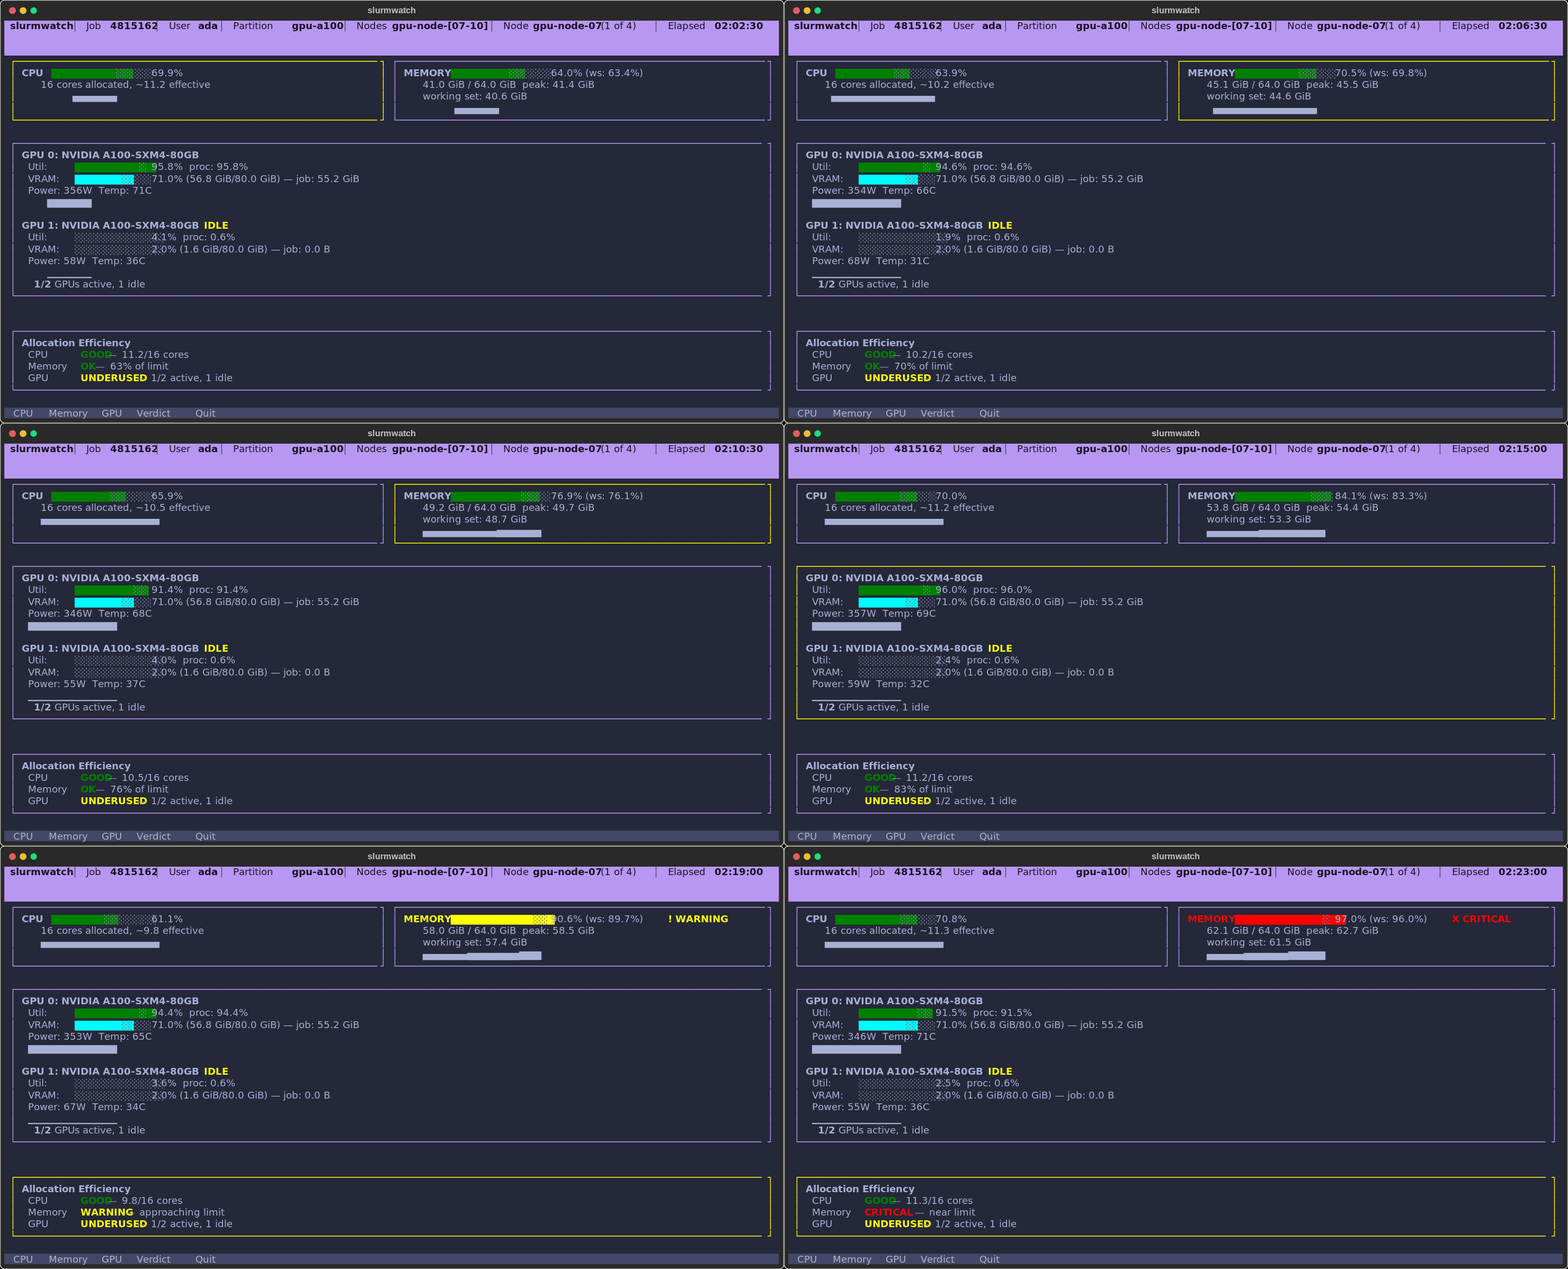
- Answer-first dashboard — a status banner states the worst problem in plain language (
MEMORY 91% — OOM RISK,1 OF 2 GPUS IDLE) and an efficiency block spells out the fix. One color rule: bars show magnitude, status dots (●healthy /▲warning /✖critical) show health. Tall history charts fill the rest of the screen so trends (memory climbing toward the limit) are visible at a glance. - Per-process GPU attribution — NVML sees only your PIDs, so a neighbor's job never inflates your numbers.
- Honest memory — working set (RSS minus reclaimable cache) with a configurable OOM guard.
- Works anywhere — full live telemetry on the node; auto-falls back to Slurm accounting (
sstat) from a login node. - Zero config —
slurmwatch <jobid>auto-discovers jobs, cgroup v1/v2, and whether it's on the node. No flags to memorize.
Install
pip install slurmwatch
Requires Python 3.10+ and Linux with cgroup v1 or v2. One install works across a mixed cluster: GPU monitoring (NVIDIA, via pynvml) auto-activates on GPU nodes and is silently skipped on CPU-only nodes. Works with pipx / uv too — e.g. uv tool install slurmwatch.
Usage
slurmwatch                       # auto-discover and attach to your running job
slurmwatch 12345                 # attach to a job (array: 12345_3, het: 12345+1)
slurmwatch --demo                # try the live TUI right now — no Slurm needed
slurmwatch 12345 --once --json   # one machine-readable snapshot, then exit
slurmwatch 12345 --log run.jsonl # headless logging (JSON Lines or CSV)
Run it from anywhere: on a login node, slurmwatch automatically attaches to the job's compute node (via srun --overlap) to show the live dashboard — no manual srun needed. If it can't attach, it falls back to an sstat summary (peak memory + CPU time + allocation); GPU utilization isn't available that way, since Slurm tracks GPU count, not per-device util. Set SLURMWATCH_NO_HOP=1 to skip the hop and always get the summary. (The attached view runs inside the job's allocation, so it counts against the job's resources.)
TUI keys: c/m/g open a CPU / memory / GPU detail view — the memory view breaks down working set vs. cache and the headroom to the OOM line, and the GPU view shows this job's per-device share (JOB% / JOB VRAM), each over a full-height history graph. Arrows/PgUp/PgDn scroll and q quits. Mouse capture is off so you can select and copy text normally; set SLURMWATCH_MOUSE=1 to enable mouse/wheel support instead.
Exit codes: 0 success · 1 runtime failure · 2 bad config. Errors go to stderr, so piped --once/--log output stays clean.
See slurmwatch --help for the full flag list. Behavior is also tunable via SLURMWATCH_* environment variables — e.g. SLURMWATCH_OOM_WARN, SLURMWATCH_GPU_IDLE_PCT, SLURMWATCH_POLL_INTERVAL (plus ASCII mode and more).
Library
import asyncio
from slurmwatch import TelemetryCollector, resolve_job_context

async def sample(job_id: str):
    collector = TelemetryCollector(resolve_job_context(job_id))
    await collector.start()
    try:
        print((await collector.next_snapshot()).to_json())
    finally:
        await collector.stop()

asyncio.run(sample("12345"))
Limitations
- NVIDIA-only GPU support (no AMD/ROCm).
- Single-node view — multi-node jobs show data for the node you're on.
- Live GPU utilization and working-set memory require running on the job's node.
License
MIT
1 maintainer

Download files
Download the file for your platform. If you're not sure which to choose, learn more about installing packages.
Source Distribution
Built Distribution
Filter files by name, interpreter, ABI, and platform.
If you're not sure about the file name format, learn more about wheel file names.
Copy a direct link to the current filters
File details
Details for the file slurmwatch-0.2.0.tar.gz.
File metadata
- Download URL: slurmwatch-0.2.0.tar.gz
- Upload date:
- Size: 3.0 MB
- Tags: Source
- Uploaded using Trusted Publishing? Yes
- Uploaded via:
twine/6.1.0 CPython/3.13.12
File hashes
| Algorithm | Hash digest | |
|---|---|---|
| SHA256 |
7097ed0befd648ad52c7282cb55398fc917414be5b4b33a78cd3f73ff201d791
|
|
| MD5 |
e70a3c38b3a9fac196b8be4b46961e62
|
|
| BLAKE2b-256 |
8ede01f8fff0caf9c4f7aa9ffc160fd8c9e159ea2abf8787eee97f599b125076
|
Provenance
The following attestation bundles were made for slurmwatch-0.2.0.tar.gz:
Publisher:
release.yml on PursuitOfDataScience/slurmwatch
-
Statement:
-
Statement type:
https://in-toto.io/Statement/v1 -
Predicate type:
https://docs.pypi.org/attestations/publish/v1 -
Subject name:
slurmwatch-0.2.0.tar.gz -
Subject digest:
7097ed0befd648ad52c7282cb55398fc917414be5b4b33a78cd3f73ff201d791 - Sigstore transparency entry: 2090142913
- Sigstore integration time:
-
Permalink:
PursuitOfDataScience/slurmwatch@fae6e48bbb85a4f1bf303c47bf6508d9a91ba27d -
Branch / Tag:
refs/tags/v0.2.0 - Owner: https://github.com/PursuitOfDataScience
-
Access:
public
-
Token Issuer:
https://token.actions.githubusercontent.com -
Runner Environment:
github-hosted -
Publication workflow:
release.yml@fae6e48bbb85a4f1bf303c47bf6508d9a91ba27d -
Trigger Event:
push
-
Statement type:
File details
Details for the file slurmwatch-0.2.0-py3-none-any.whl.
File metadata
- Download URL: slurmwatch-0.2.0-py3-none-any.whl
- Upload date:
- Size: 58.2 kB
- Tags: Python 3
- Uploaded using Trusted Publishing? Yes
- Uploaded via:
twine/6.1.0 CPython/3.13.12
File hashes
| Algorithm | Hash digest | |
|---|---|---|
| SHA256 |
a24922b5e0f5018b7bd21a02abfad988ba1bcabab4f608d849c543731535dc2a
|
|
| MD5 |
5d597fd29bde1e73abebd3cec043c501
|
|
| BLAKE2b-256 |
0ec2bc0819b0344f07a66e119a208a5a174d7e300364404c99e3f8b5c679ac44
|
Provenance
The following attestation bundles were made for slurmwatch-0.2.0-py3-none-any.whl:
Publisher:
release.yml on PursuitOfDataScience/slurmwatch
-
Statement:
-
Statement type:
https://in-toto.io/Statement/v1 -
Predicate type:
https://docs.pypi.org/attestations/publish/v1 -
Subject name:
slurmwatch-0.2.0-py3-none-any.whl -
Subject digest:
a24922b5e0f5018b7bd21a02abfad988ba1bcabab4f608d849c543731535dc2a - Sigstore transparency entry: 2090143206
- Sigstore integration time:
-
Permalink:
PursuitOfDataScience/slurmwatch@fae6e48bbb85a4f1bf303c47bf6508d9a91ba27d -
Branch / Tag:
refs/tags/v0.2.0 - Owner: https://github.com/PursuitOfDataScience
-
Access:
public
-
Token Issuer:
https://token.actions.githubusercontent.com -
Runner Environment:
github-hosted -
Publication workflow:
release.yml@fae6e48bbb85a4f1bf303c47bf6508d9a91ba27d -
Trigger Event:
push
-
Statement type:







