
slurmwatch
Live per-process CPU / memory / GPU telemetry for a running Slurm job — the facts, so you can judge.


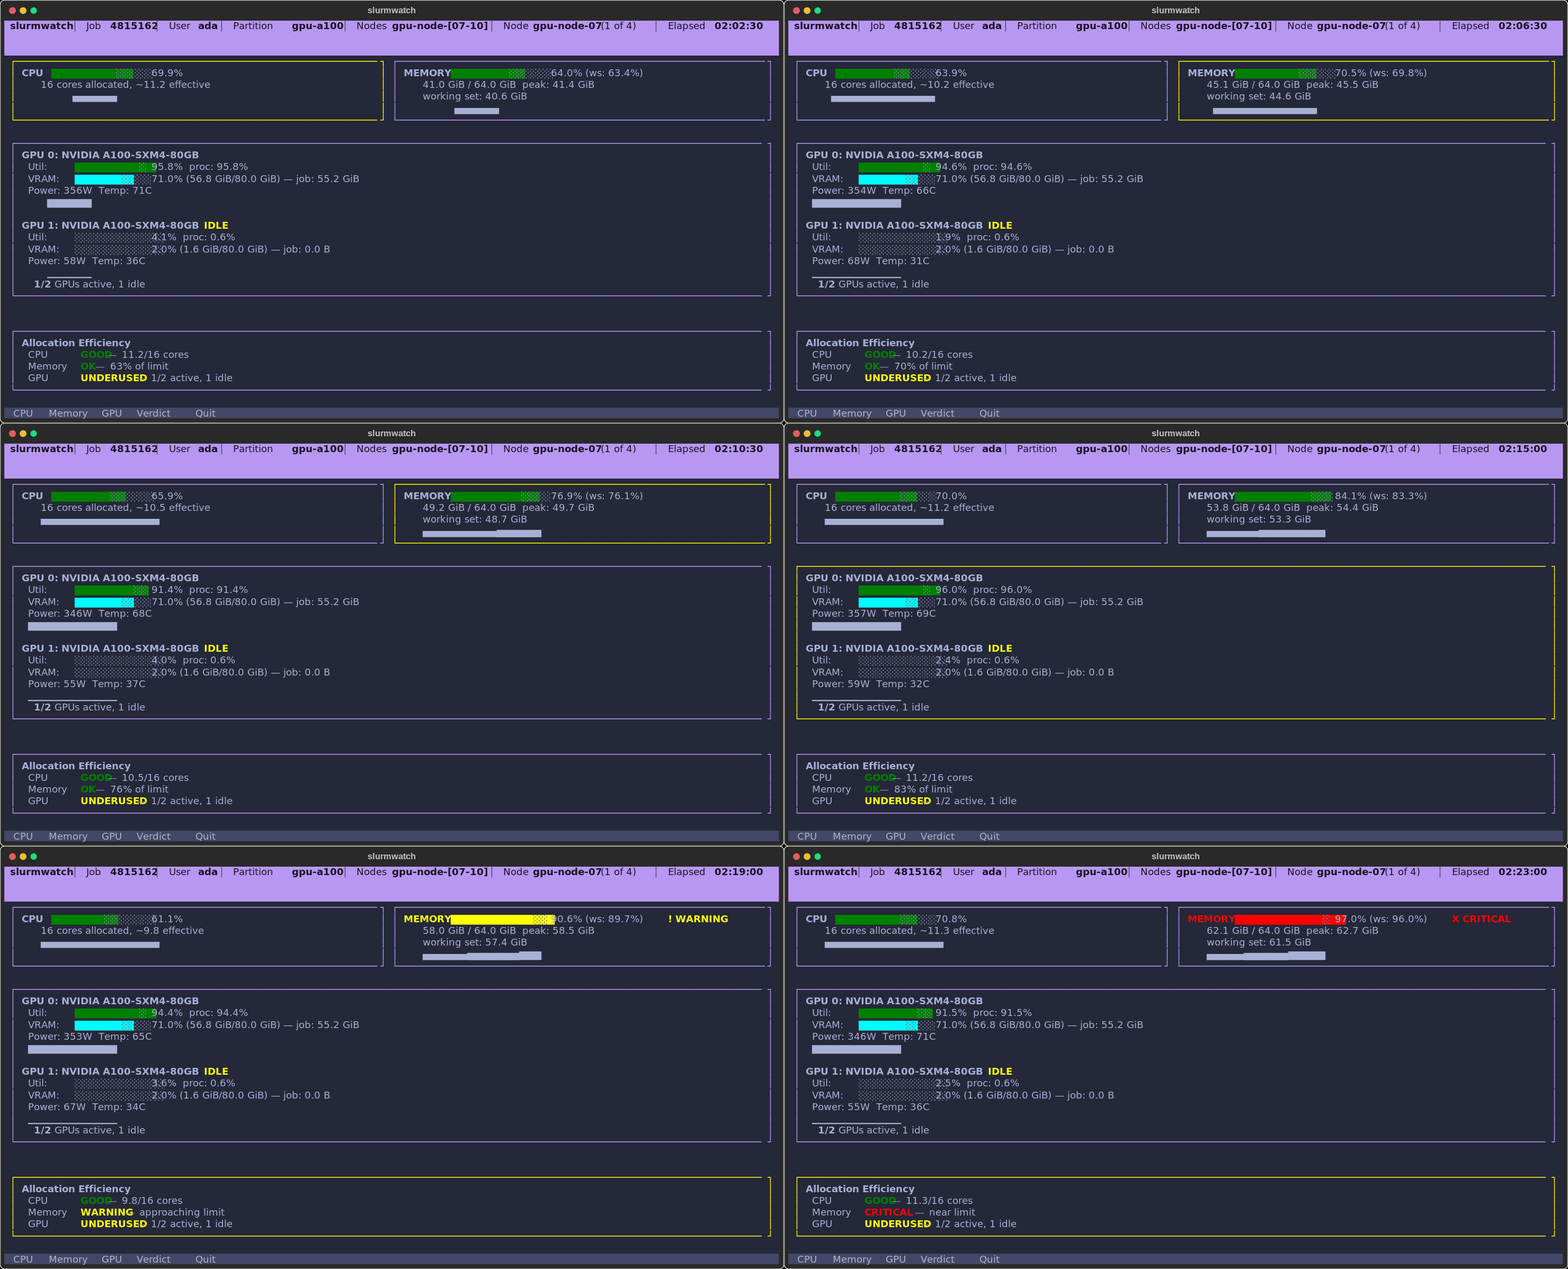
Run slurmwatch <jobid> from a login node — it attaches to your job's compute node for you and shows a live dashboard. No manual srun, no flags to memorize.
Features
- Facts, not verdicts — labelled bars (
usage·used·compute·vram), each with its recent 60-second range and a health dot (●/▲/✖). An alarm strip surfaces only what needs action (MEMORY 91% of limit,1 OF 2 GPUS IDLE). - Per-process — NVML and cgroups count only your PIDs, so a neighbour on a shared node never inflates your numbers.
- Honest memory — working set (RSS minus reclaimable cache), against a configurable OOM guard.
- Multi-node — one process, every node: type a node's number (or step with
◂ ▸) to switch which node the dashboard shows — jump straight to node 199 of a 200-node job. - Runs anywhere — full live telemetry on the node; falls back to Slurm accounting (
sstat) when it can't attach. - Zero config — auto-discovers the job, cgroup v1/v2, GPUs, and where it's running.
Install
pip install slurmwatch # or: uv tool install slurmwatch / pipx install slurmwatch
Python 3.10+ on Linux (cgroup v1 or v2). One install fits a mixed cluster — NVIDIA GPU monitoring (via pynvml) auto-activates on GPU nodes and is skipped on CPU-only ones.
Usage
slurmwatch                       # auto-discover and attach to your running job
slurmwatch 12345                 # a specific job (array 12345_3, het 12345+1)
sw 12345                         # "sw" is a short alias
slurmwatch --demo                # try the live TUI now — no Slurm needed
slurmwatch 12345 --once --json   # one machine-readable snapshot, then exit
slurmwatch 12345 --log run.jsonl # headless logging (JSONL or CSV)
Keys — c / m / g: CPU / memory / GPU detail view · type a node number (or ◂ ▸): switch node on a multi-node job · p: reveal a truncated command/workdir path · ↑ ↓ PgUp PgDn: scroll · q: quit.
From a login node, slurmwatch attaches to the compute node via srun --overlap (so the view runs inside your allocation). Can't attach? It shows an sstat summary — peak memory, CPU time, allocation — but not live GPU utilization, which Slurm doesn't track per device. SLURMWATCH_NO_HOP=1 forces the summary; --ascii suits a non-UTF-8 terminal; SLURMWATCH_MOUSE=1 enables the wheel (mouse capture is off by default so text selection works). See slurmwatch --help and the SLURMWATCH_* env vars for the rest.
Library
import asyncio
from slurmwatch import TelemetryCollector, resolve_job_context

async def sample(job_id):
    collector = TelemetryCollector(resolve_job_context(job_id))
    await collector.start()
    try:
        print((await collector.next_snapshot()).to_json())
    finally:
        await collector.stop()

asyncio.run(sample("12345"))
Limitations
- NVIDIA only (no AMD/ROCm).
- One node on screen at a time — switch by typing its number (or
◂ ▸); non-local nodes refresh a few seconds slower. No cross-node aggregate. - Live GPU utilization and working-set memory need to run on the job's node.
License
MIT
1 maintainer

Download files
Download the file for your platform. If you're not sure which to choose, learn more about installing packages.
Source Distribution
Built Distribution
Filter files by name, interpreter, ABI, and platform.
If you're not sure about the file name format, learn more about wheel file names.
Copy a direct link to the current filters
File details
Details for the file slurmwatch-0.4.0.tar.gz.
File metadata
- Download URL: slurmwatch-0.4.0.tar.gz
- Upload date:
- Size: 3.7 MB
- Tags: Source
- Uploaded using Trusted Publishing? Yes
- Uploaded via:
twine/6.1.0 CPython/3.13.12
File hashes
| Algorithm | Hash digest | |
|---|---|---|
| SHA256 |
60af02143b965b56b5fea33e04afc1668975359f597651b44526ca1a12b1abe0
|
|
| MD5 |
bd5e7ef9aa34769df243cca73dc3dec2
|
|
| BLAKE2b-256 |
d836a5332aea3d7c38b22d545fe1c63bd53091f833b36557fe9c0956e920446d
|
Provenance
The following attestation bundles were made for slurmwatch-0.4.0.tar.gz:
Publisher:
release.yml on PursuitOfDataScience/slurmwatch
-
Statement:
-
Statement type:
https://in-toto.io/Statement/v1 -
Predicate type:
https://docs.pypi.org/attestations/publish/v1 -
Subject name:
slurmwatch-0.4.0.tar.gz -
Subject digest:
60af02143b965b56b5fea33e04afc1668975359f597651b44526ca1a12b1abe0 - Sigstore transparency entry: 2129579190
- Sigstore integration time:
-
Permalink:
PursuitOfDataScience/slurmwatch@2dc9acf4c189057833a8ccfd185d5a45c8a0b1b4 -
Branch / Tag:
refs/tags/v0.4.0 - Owner: https://github.com/PursuitOfDataScience
-
Access:
public
-
Token Issuer:
https://token.actions.githubusercontent.com -
Runner Environment:
github-hosted -
Publication workflow:
release.yml@2dc9acf4c189057833a8ccfd185d5a45c8a0b1b4 -
Trigger Event:
push
-
Statement type:
File details
Details for the file slurmwatch-0.4.0-py3-none-any.whl.
File metadata
- Download URL: slurmwatch-0.4.0-py3-none-any.whl
- Upload date:
- Size: 74.6 kB
- Tags: Python 3
- Uploaded using Trusted Publishing? Yes
- Uploaded via:
twine/6.1.0 CPython/3.13.12
File hashes
| Algorithm | Hash digest | |
|---|---|---|
| SHA256 |
0a3c5fdc4a8c8caf7ad8c9a93ffe8ba4bf0457360657d8e95320f0221ff5da73
|
|
| MD5 |
dc62b78db7c04a4e0861e75dd2cc4a4f
|
|
| BLAKE2b-256 |
7350cf8c83c95bca5d58f80696bc5721696a9c5a67f9adeefd454cbc092ea482
|
Provenance
The following attestation bundles were made for slurmwatch-0.4.0-py3-none-any.whl:
Publisher:
release.yml on PursuitOfDataScience/slurmwatch
-
Statement:
-
Statement type:
https://in-toto.io/Statement/v1 -
Predicate type:
https://docs.pypi.org/attestations/publish/v1 -
Subject name:
slurmwatch-0.4.0-py3-none-any.whl -
Subject digest:
0a3c5fdc4a8c8caf7ad8c9a93ffe8ba4bf0457360657d8e95320f0221ff5da73 - Sigstore transparency entry: 2129579300
- Sigstore integration time:
-
Permalink:
PursuitOfDataScience/slurmwatch@2dc9acf4c189057833a8ccfd185d5a45c8a0b1b4 -
Branch / Tag:
refs/tags/v0.4.0 - Owner: https://github.com/PursuitOfDataScience
-
Access:
public
-
Token Issuer:
https://token.actions.githubusercontent.com -
Runner Environment:
github-hosted -
Publication workflow:
release.yml@2dc9acf4c189057833a8ccfd185d5a45c8a0b1b4 -
Trigger Event:
push
-
Statement type:







