
slurmwatch
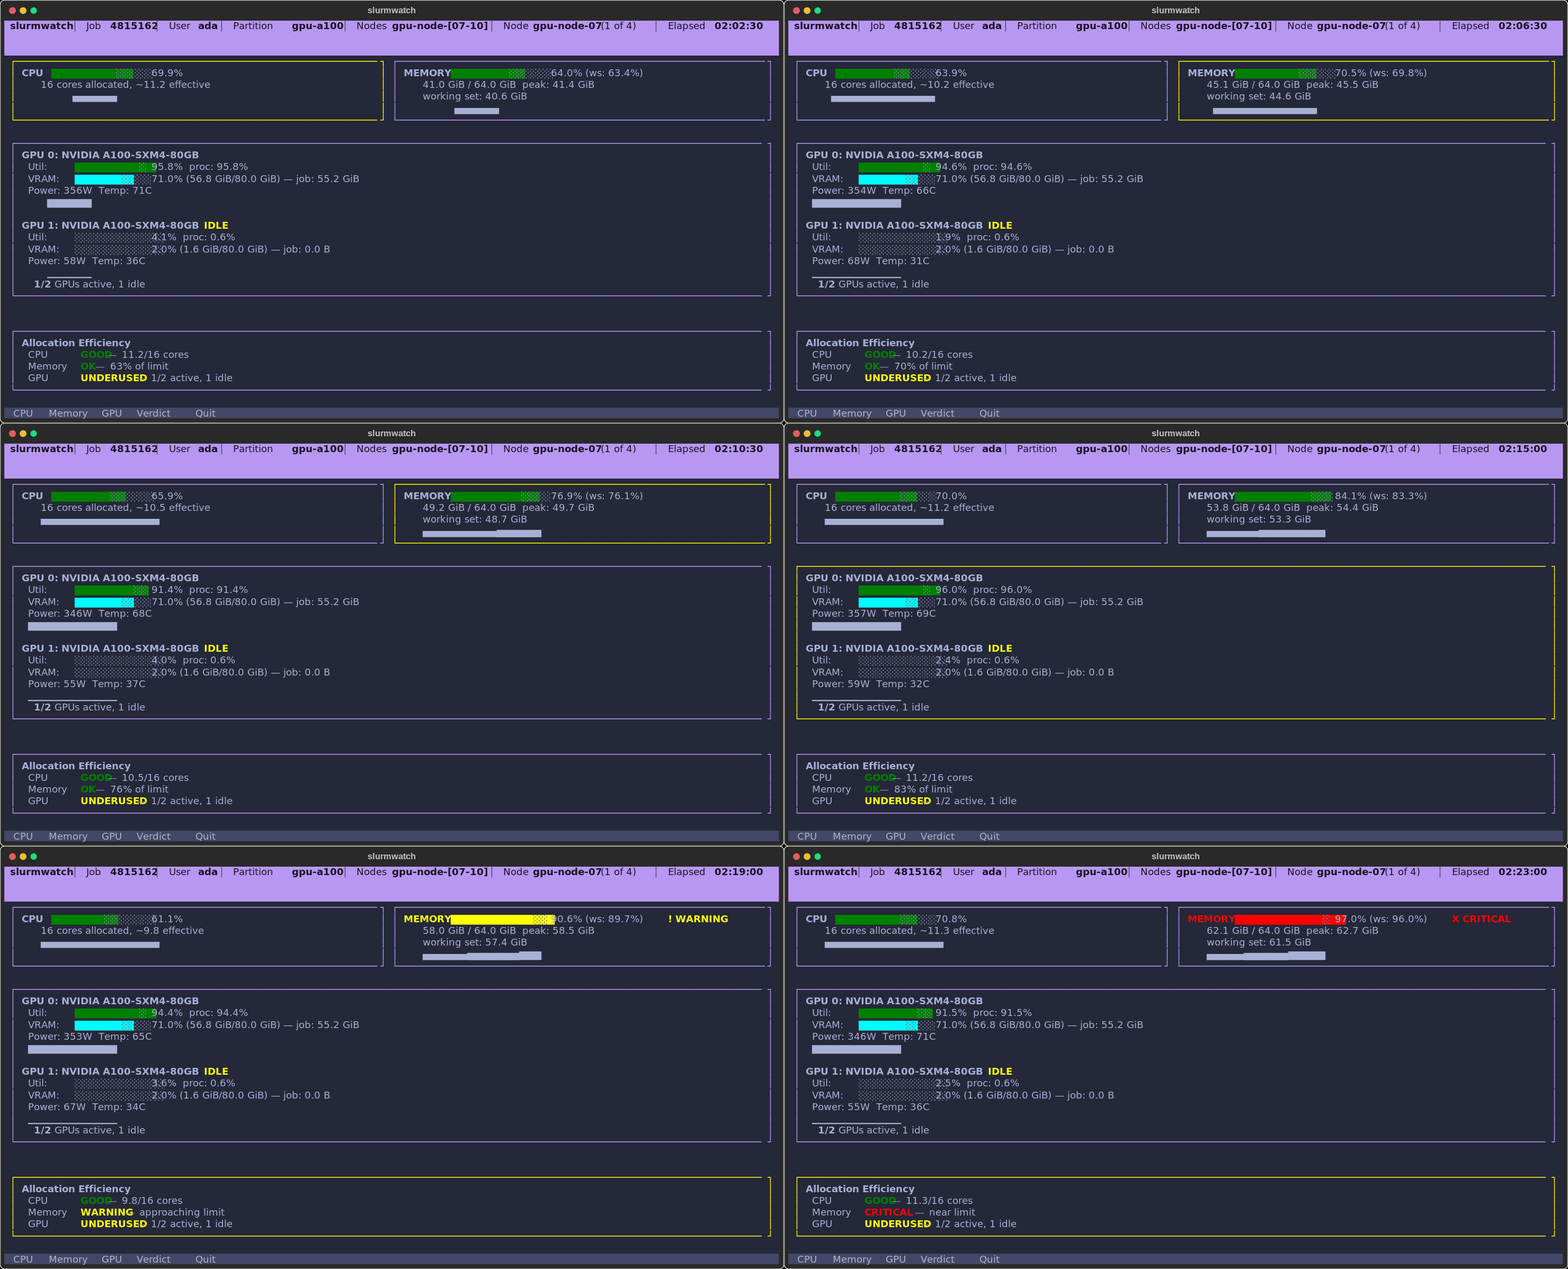
Live per-process CPU / memory / GPU telemetry for a running Slurm job — the facts, so you can judge.


Install
pip install slurmwatch # or: uv tool install slurmwatch / pipx install slurmwatch
Python 3.10+ on Linux (cgroup v1/v2). GPU monitoring (pynvml) auto-activates on NVIDIA nodes and is skipped on CPU-only ones.
Usage
slurmwatch                       # auto-discover and attach to your running job
slurmwatch 12345                 # a specific job (array 12345_3, het 12345+1)
sw 12345                         # "sw" is a short alias
slurmwatch --demo                # live TUI, no Slurm needed
slurmwatch --demo pending        # preview the pending-job view offline
slurmwatch 12345 --once --json   # one machine-readable snapshot, then exit
slurmwatch 12345 --log run.jsonl # headless logging (JSONL or CSV)
Point it at a pending job and, instead of an error, you get why it's waiting, when it should start, and where it could run — no flags needed.
Keys — c/m/g open a full-screen CPU/memory/GPU drill-in (in the GPU view ↑/↓ pick a device) · type a node number (or ←/→) to switch node · p reveal a truncated path · ↑/↓ PgUp/PgDn scroll · q back/quit.
Notes
- From a login node it attaches to the compute node via
srun --overlap, so the view runs inside your allocation. The attach is bounded and always opens the dashboard (CPU/memory/processes) — even when the GPU can't be read. - Live GPU util needs the GPU to be reachable from a monitor step. If your batch script launches the GPU program directly (
python train.py), the GPU sits in the.batchstep and slurmwatch reads it. If it launches via an innersrun(srun python train.py), that step locks the GPU exclusively (Slurm won't share a GPU across steps and blocks device access via cgroups), so a separate monitor step can't read GPU util — the dashboard shows everything else live and says so. To get live GPU on such a job, run the program without the innersrun(multi-node distributed training that must usesrunis the exception — there's no way to read its GPU after the fact). - Can't attach at all? You get an
sstatsummary — peak memory, CPU time, allocation — but no live GPU utilization, which Slurm doesn't track per device. SLURMWATCH_NO_HOP=1forces the summary ·--asciifor a non-UTF-8 terminal ·SLURMWATCH_MOUSE=1enables the wheel (off by default so text selection works).- Everything else:
slurmwatch --helpand theSLURMWATCH_*env vars.
Features
- Facts, not verdicts — labelled bars (
usage·used·compute·vram), each with its recent 60-second range and a health dot (●/▲/✖). An alarm strip surfaces only what needs action (MEMORY 91% of limit,1 OF 2 GPUS IDLE). - Drill in —
c/m/gopen a focused full-screen view of one resource: the live figure in large digits plus a 60-second area chart of its recent history. In the GPU view, arrow through devices and the chart follows the one you pick. - Per-process — NVML and cgroups count only your PIDs, so a neighbour on a shared node never inflates your numbers.
- Honest memory — working set (RSS minus reclaimable cache), against a configurable OOM guard.
- Multi-node — one process, every node: type a node's number (or step with
◂ ▸) to switch which node the dashboard shows — jump straight to node 199 of a 200-node job. - Pending jobs — point it at a queued job and instead of an error you get why it's waiting (the Slurm reason, in plain English), when the scheduler estimates it'll start, and where it could run right now — a cluster-wide view of free capacity that flags any partition your request would fit into, with the exact
scontrol updateto requeue there. - Runs anywhere — full live telemetry on the node; falls back to Slurm accounting (
sstat) when it can't attach. - Zero config — auto-discovers the job, cgroup v1/v2, GPUs, and where it's running.
1 maintainer

Download files
Download the file for your platform. If you're not sure which to choose, learn more about installing packages.
Source Distribution
Built Distribution
Filter files by name, interpreter, ABI, and platform.
If you're not sure about the file name format, learn more about wheel file names.
Copy a direct link to the current filters
File details
Details for the file slurmwatch-0.8.1.tar.gz.
File metadata
- Download URL: slurmwatch-0.8.1.tar.gz
- Upload date:
- Size: 3.8 MB
- Tags: Source
- Uploaded using Trusted Publishing? Yes
- Uploaded via:
twine/6.1.0 CPython/3.13.12
File hashes
| Algorithm | Hash digest | |
|---|---|---|
| SHA256 |
d527d441306bf86a8beadf50e26e233b7fbb233fcf9bfc8ca6699954ff4a75dc
|
|
| MD5 |
4ce880f0b866d2bfc34fec9ef458ea6f
|
|
| BLAKE2b-256 |
0924f6aeb414bb969f0e4eb34f874e8a8385d046762c5f452bbc0b0201aa9266
|
Provenance
The following attestation bundles were made for slurmwatch-0.8.1.tar.gz:
Publisher:
release.yml on PursuitOfDataScience/slurmwatch
-
Statement:
-
Statement type:
https://in-toto.io/Statement/v1 -
Predicate type:
https://docs.pypi.org/attestations/publish/v1 -
Subject name:
slurmwatch-0.8.1.tar.gz -
Subject digest:
d527d441306bf86a8beadf50e26e233b7fbb233fcf9bfc8ca6699954ff4a75dc - Sigstore transparency entry: 2168282819
- Sigstore integration time:
-
Permalink:
PursuitOfDataScience/slurmwatch@1d0237ccfb8b9fb2e3dc3b592c266a3d88e0cf3c -
Branch / Tag:
refs/tags/v0.8.1 - Owner: https://github.com/PursuitOfDataScience
-
Access:
public
-
Token Issuer:
https://token.actions.githubusercontent.com -
Runner Environment:
github-hosted -
Publication workflow:
release.yml@1d0237ccfb8b9fb2e3dc3b592c266a3d88e0cf3c -
Trigger Event:
push
-
Statement type:
File details
Details for the file slurmwatch-0.8.1-py3-none-any.whl.
File metadata
- Download URL: slurmwatch-0.8.1-py3-none-any.whl
- Upload date:
- Size: 119.1 kB
- Tags: Python 3
- Uploaded using Trusted Publishing? Yes
- Uploaded via:
twine/6.1.0 CPython/3.13.12
File hashes
| Algorithm | Hash digest | |
|---|---|---|
| SHA256 |
90fd6c6b9c8c1b4474d555050e211c4983aed9b332c96e5521c939c22ec62989
|
|
| MD5 |
a27d3c06702a55e617ae7beaebd2e4de
|
|
| BLAKE2b-256 |
284457530d6c568784d761f117db334d6ac8df391f7e5995e4a961aeba54f3c6
|
Provenance
The following attestation bundles were made for slurmwatch-0.8.1-py3-none-any.whl:
Publisher:
release.yml on PursuitOfDataScience/slurmwatch
-
Statement:
-
Statement type:
https://in-toto.io/Statement/v1 -
Predicate type:
https://docs.pypi.org/attestations/publish/v1 -
Subject name:
slurmwatch-0.8.1-py3-none-any.whl -
Subject digest:
90fd6c6b9c8c1b4474d555050e211c4983aed9b332c96e5521c939c22ec62989 - Sigstore transparency entry: 2168282981
- Sigstore integration time:
-
Permalink:
PursuitOfDataScience/slurmwatch@1d0237ccfb8b9fb2e3dc3b592c266a3d88e0cf3c -
Branch / Tag:
refs/tags/v0.8.1 - Owner: https://github.com/PursuitOfDataScience
-
Access:
public
-
Token Issuer:
https://token.actions.githubusercontent.com -
Runner Environment:
github-hosted -
Publication workflow:
release.yml@1d0237ccfb8b9fb2e3dc3b592c266a3d88e0cf3c -
Trigger Event:
push
-
Statement type:







