An open source library for statistical plotting


Project description
Lets-Plot


Lets-Plot is a multiplatform plotting library built on the principles of the Grammar of Graphics.
The library design is heavily influenced by Leland Wilkinson's work The Grammar of Graphics describing the deep features that underlie all statistical graphics.
This grammar [...] is made up of a set of independent components that can be composed in many different ways. This makes [it] very powerful because you are not limited to a set of pre-specified graphics, but you can create new graphics that are precisely tailored for your problem.
- Hadley Wickham, "ggplot2: Elegant Graphics for Data Analysis"
Grammar of Graphics for Python 
A bridge between R (ggplot2) and Python data visualization.
To learn more, see the documentation site at lets-plot.org/python.
Grammar of Graphics for Kotlin 
Notebooks
Create plots in Kotlin Notebook,
Datalore, Jupyter with Kotlin Kernel
or any other notebook that supports Kotlin Kernel.
To learn more, see the Lets-Plot Kotlin API project at GitHub.
Compose Multiplatform
Embed Lets-Plot charts in Compose Multiplatform applications.
To learn more, see the Lets-Plot Compose Frontend project at GitHub.
JVM and Kotlin/JS
Embed Lets-Plot charts in JVM (Swing, JavaFX) and Kotlin/JS applications.
To learn more, see the Lets-Plot Kotlin API project at GitHub.
Documentation
Kotlin API documentation site: lets-plot.org/kotlin.
"Lets-Plot in SciView" plugin


Scientific mode in PyCharm and in IntelliJ IDEA provides support for interactive scientific computing and data visualization.
Lets-Plot in SciView plugin adds support for interactive plotting to IntelliJ-based IDEs with the Scientific mode enabled.
Note: The Scientific mode is NOT available in communinty editions of JetBrains IDEs.
Also read:
What is new in 4.8.0
-
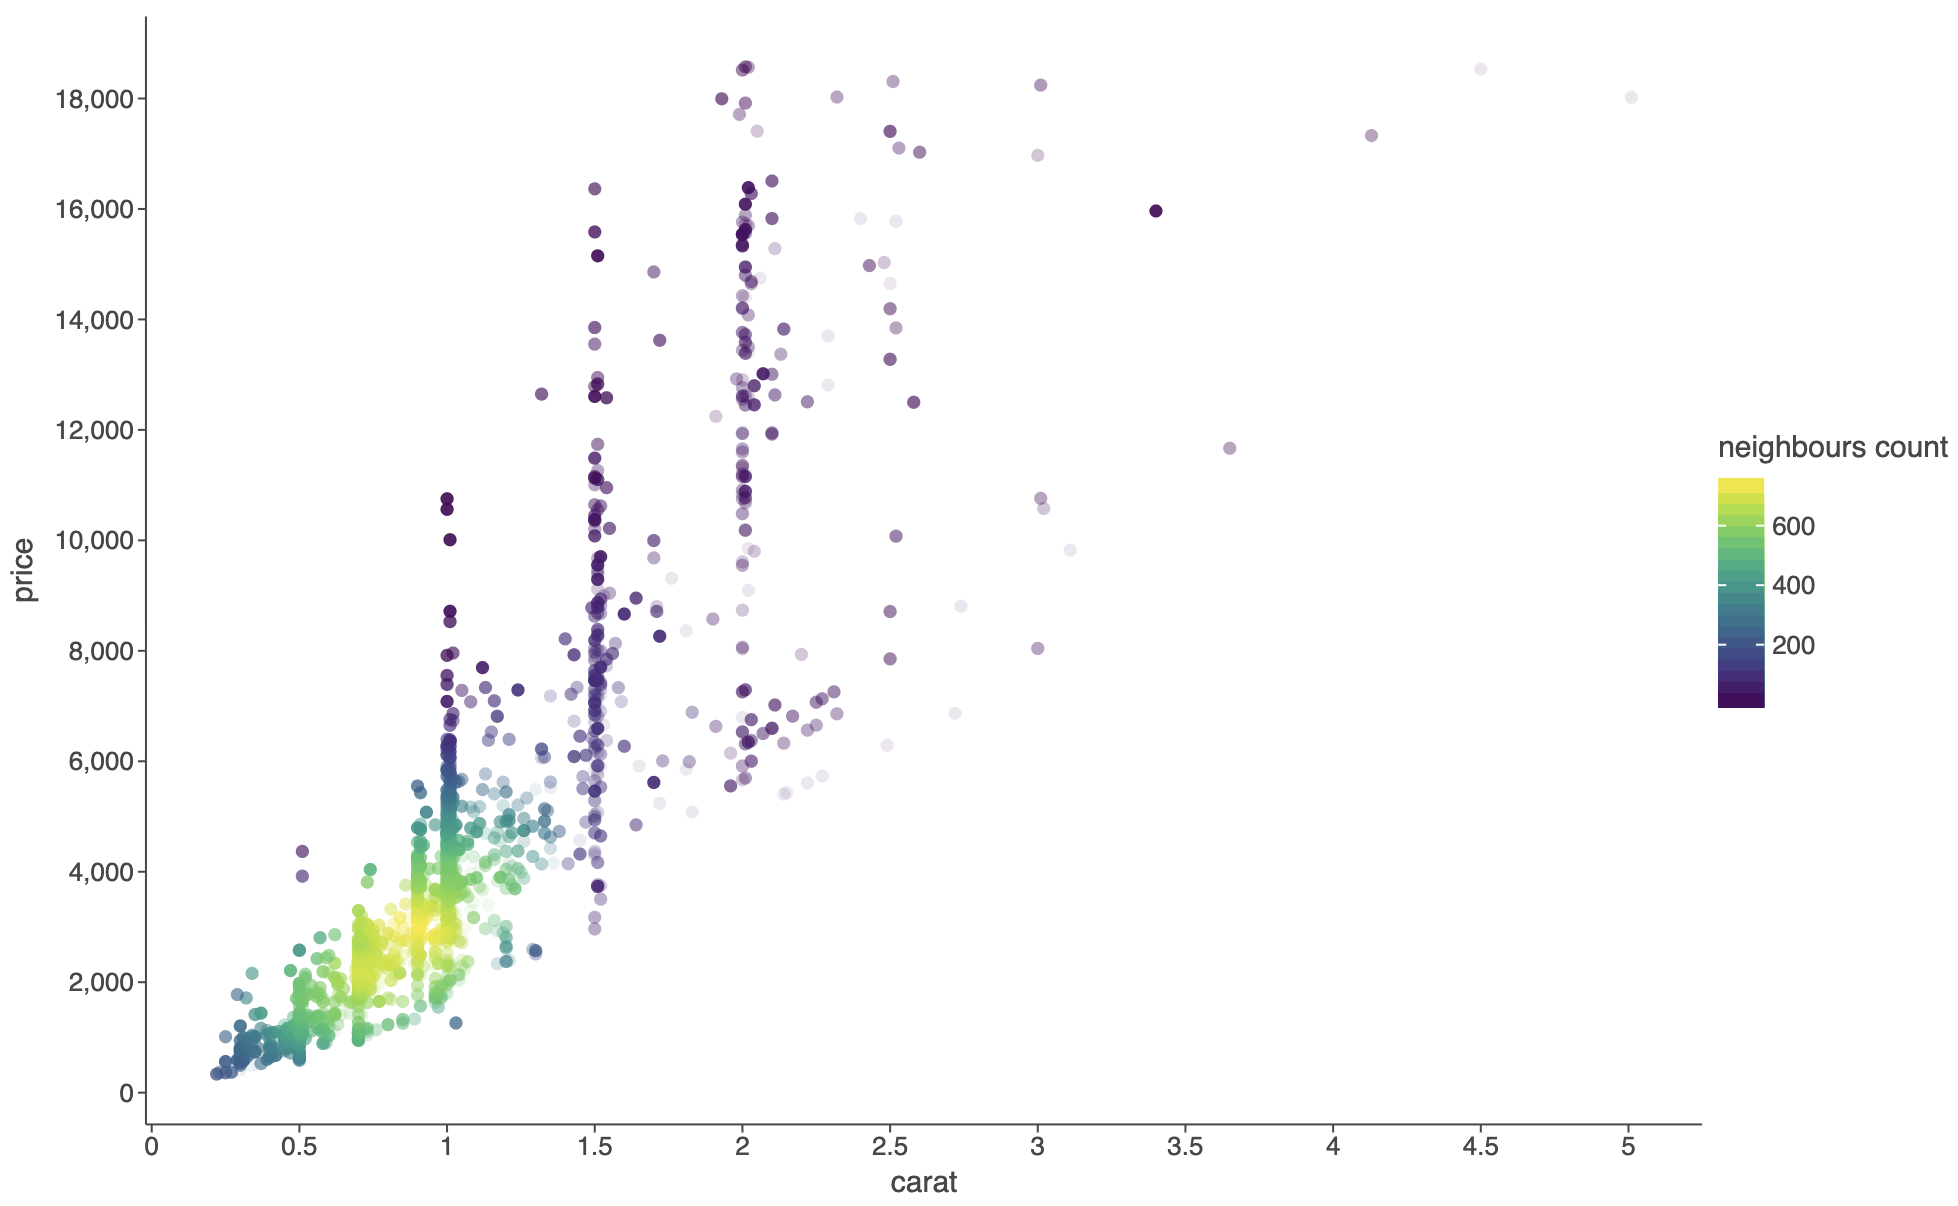
geom_pointdensity()GeometrySee example notebook.
-
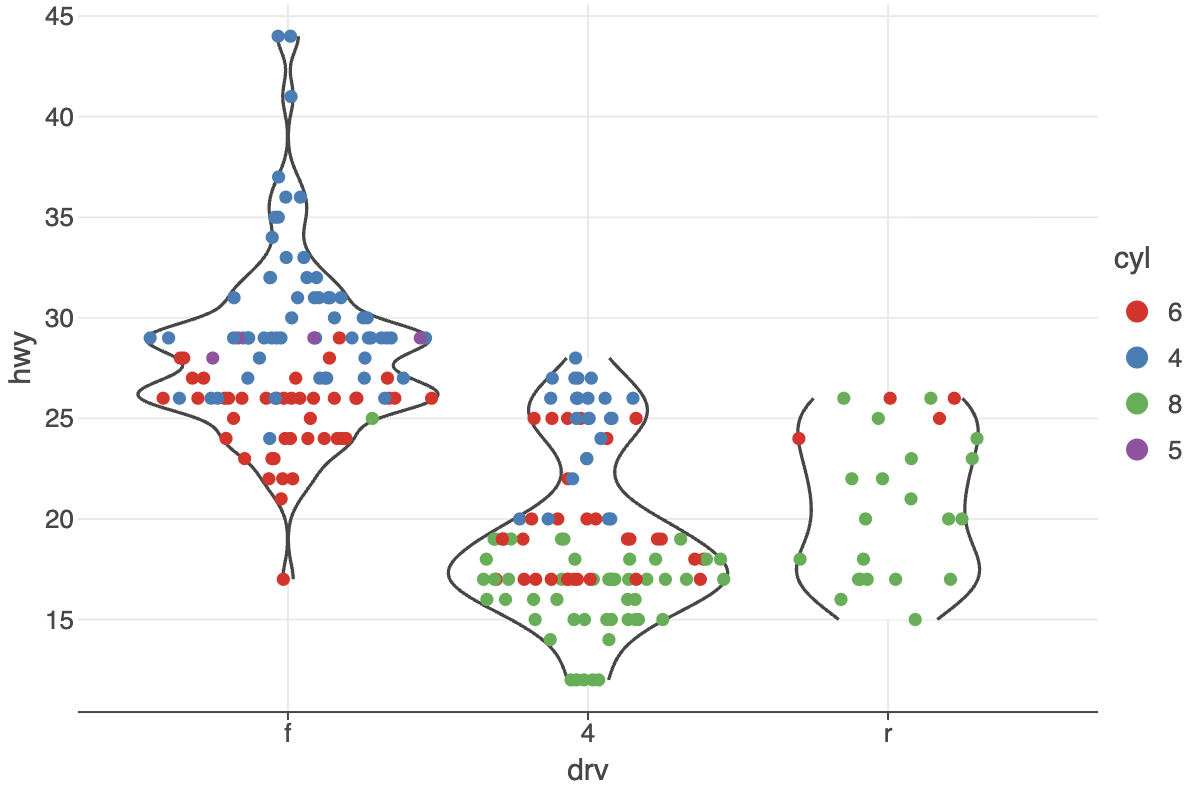
Explicit
groupaesthetic now overrides default grouping behavior instead of combining with it
[!IMPORTANT] BREAKING CHANGE:
Previously, setting
group='variable'would group by both the explicit variable AND any discrete aesthetics (color, shape, etc.).
Now it groups ONLY by the explicit variable, matchingggplot2behavior.
Usegroup=[var1, var2, ...]to group by multiple variables explicitly,
andgroup=[]to disable any grouping.
See example notebook.
-
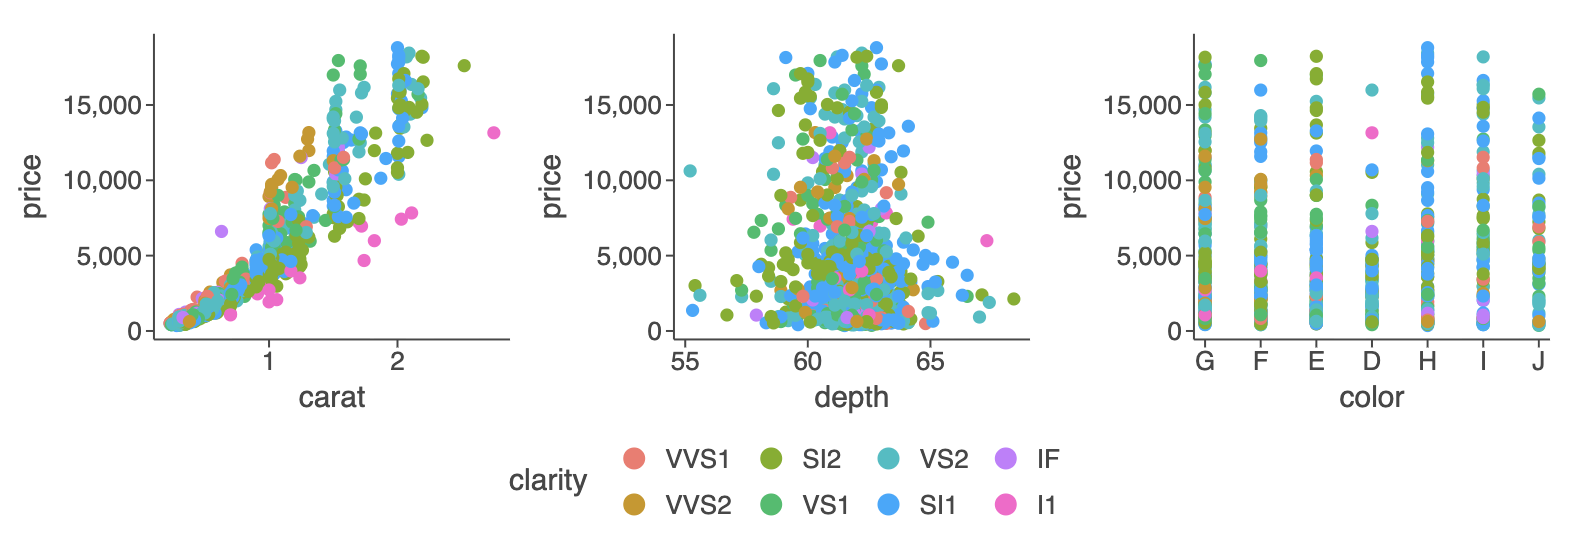
gggrid(): support for shared legends (parameterguides)See example notebook.
-
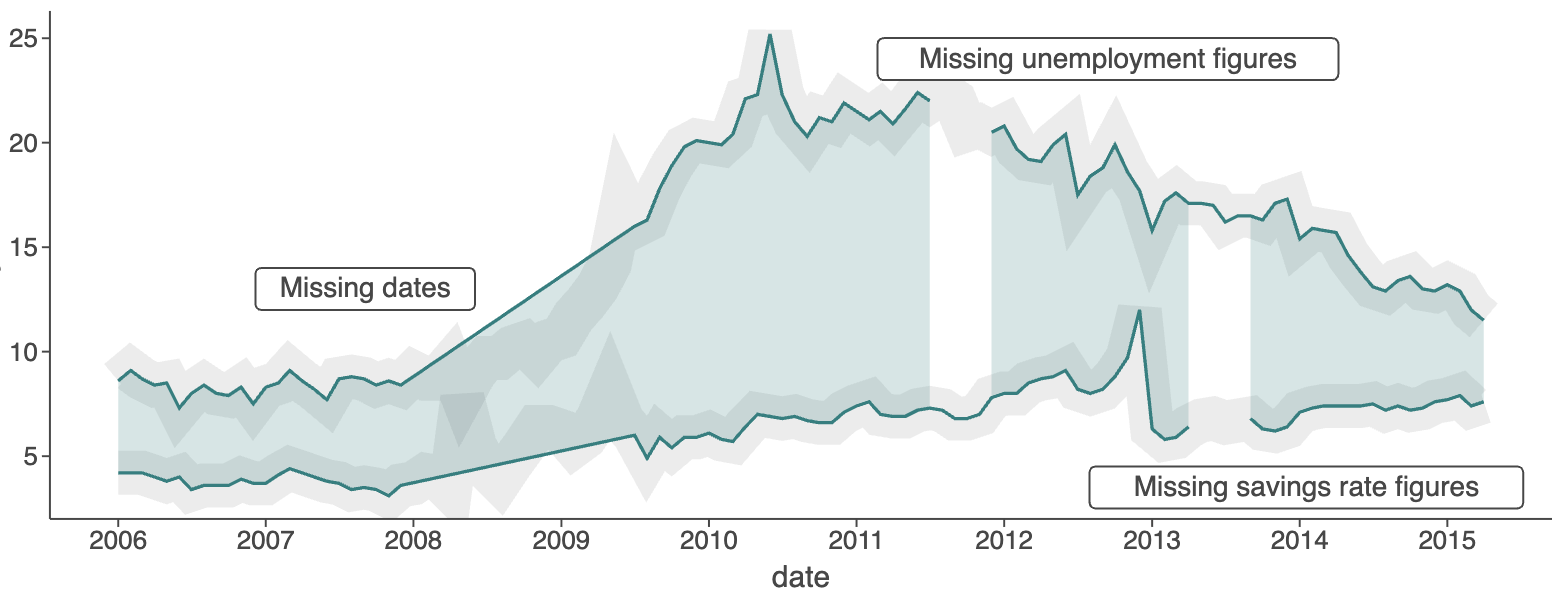
Better handling of missing values in
geom_line(), geom_path(), geom_ribbon(), andgeom_area()See example notebook.
-
geom_histogram(): custom bin bounds (parameterbreaks)See example notebook.
-
Legend automatically wraps to prevent overlap — up to 15 rows for vertical legends and 5 columns for horizontal ones
See example notebook.
-
flavor_standard()resets the theme's default color schemeUse to override other flavors or make defaults explicit.
See example notebook.
-
'left','right','top', and'bottom'legend justificationSee example notebook.
-
ggtb(): Addedsize_zoominandsize_basisparameters to control point size scaling behavior when zooming (works withgeom_pointand related layers).See: example notebook.
-
And More
See CHANGELOG.md for a full list of changes.
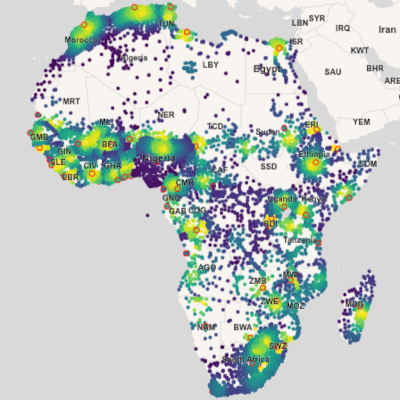
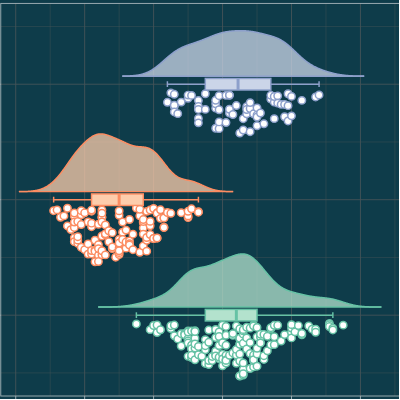
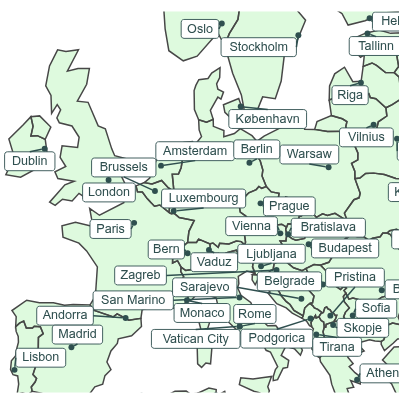
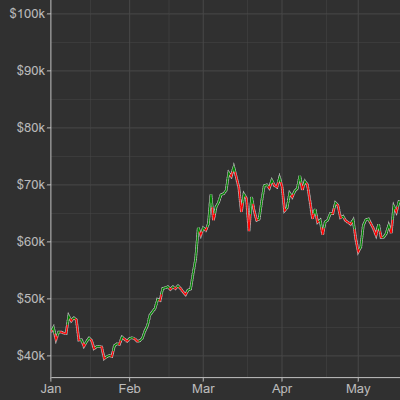
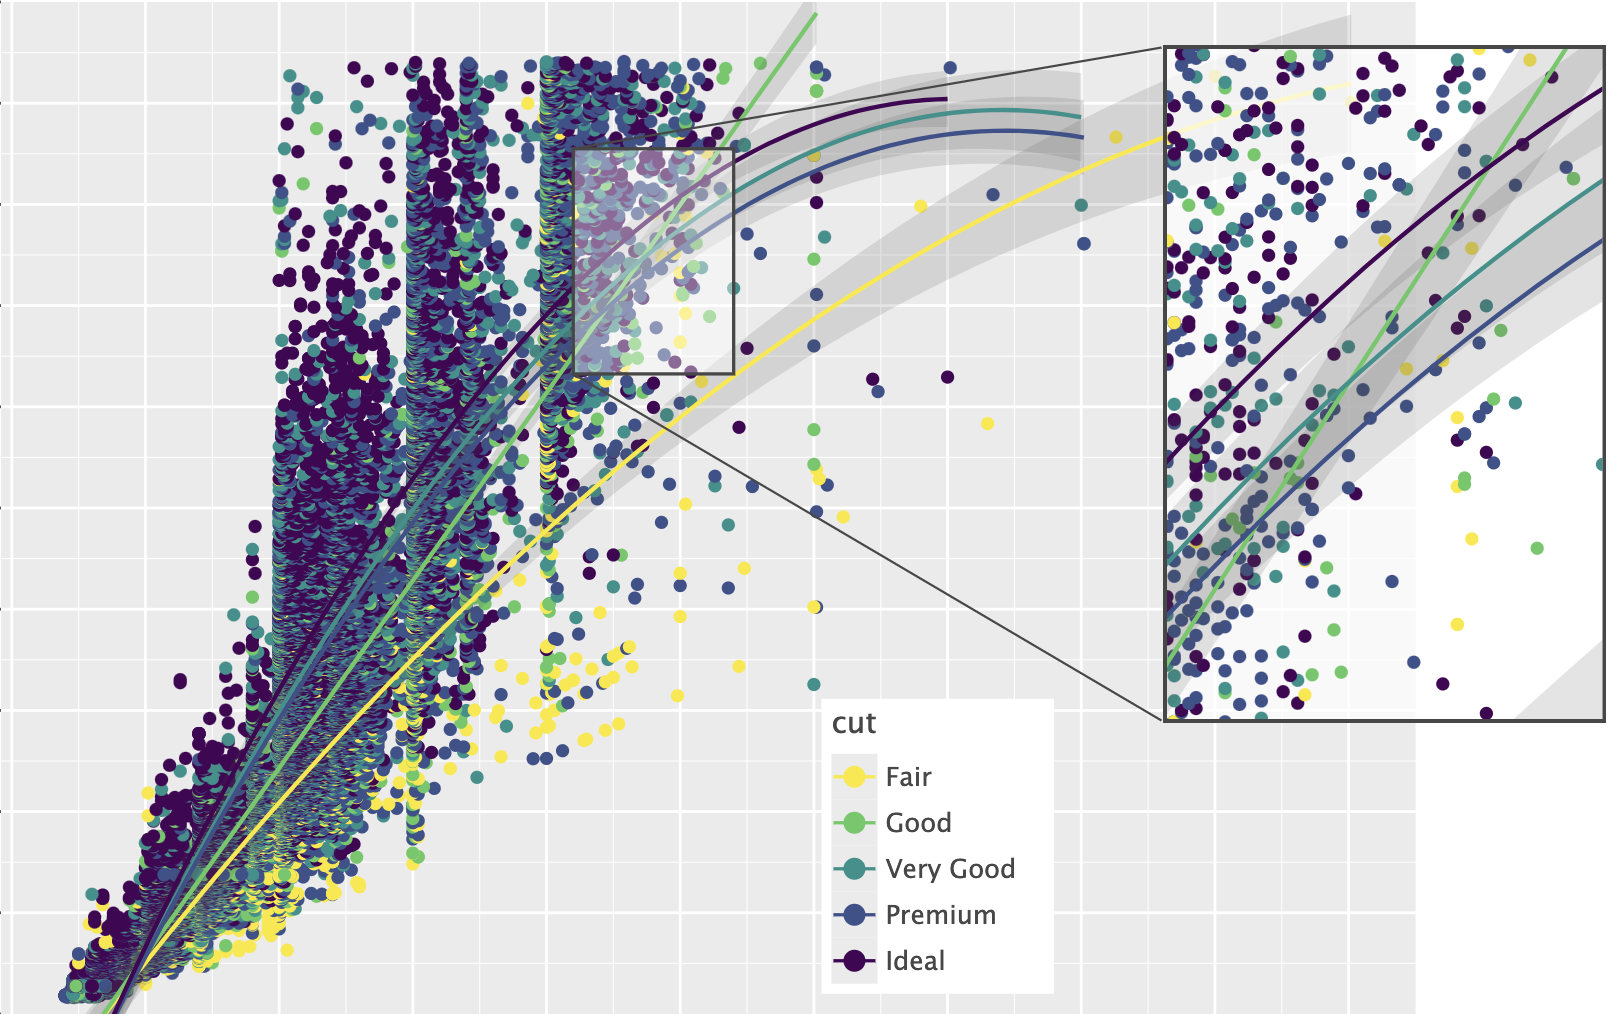
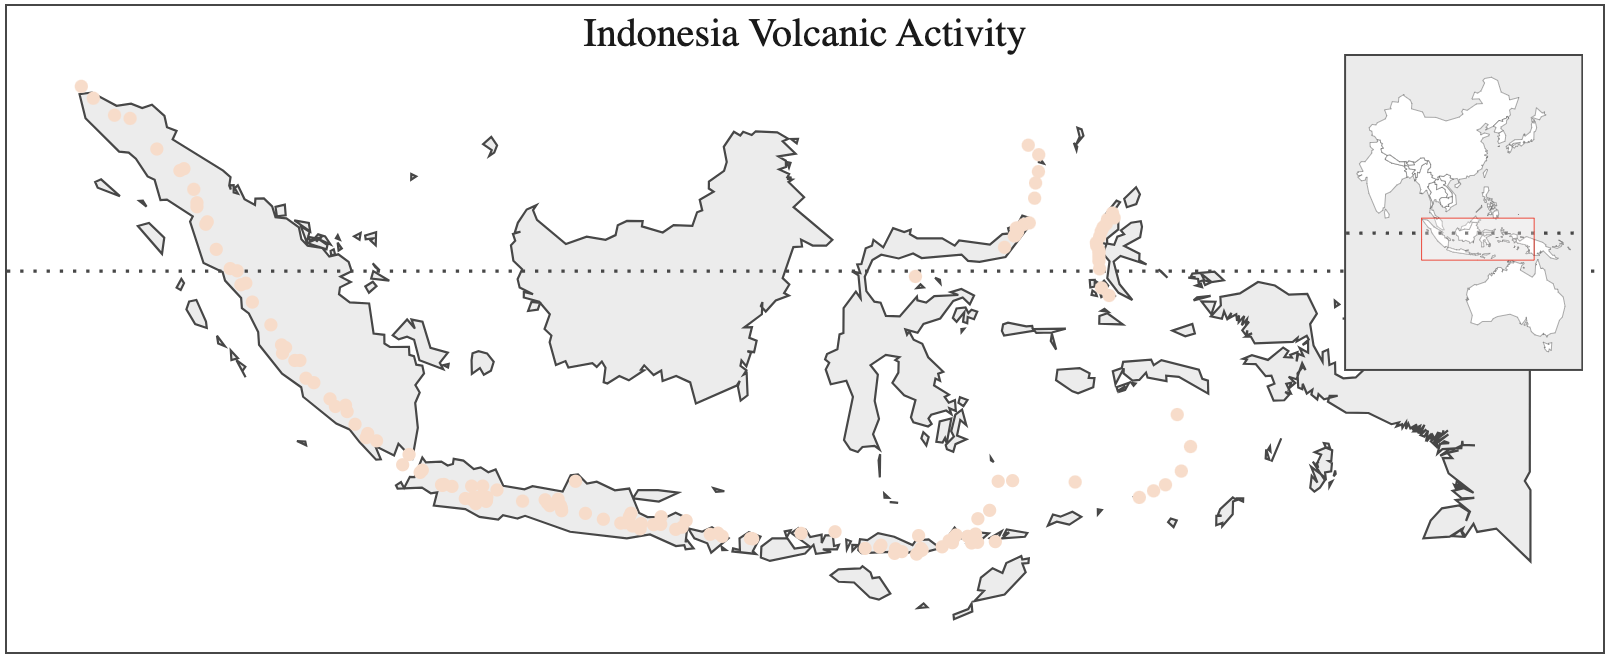
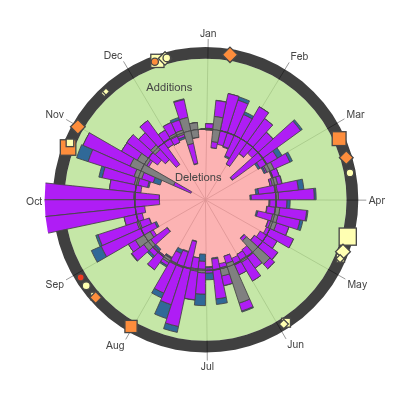
Recent Updates in the Gallery
Change Log
Code of Conduct
This project and the corresponding community are governed by the JetBrains Open Source and Community Code of Conduct. Please make sure you read it.
License
Code and documentation released under the MIT license. Copyright © 2019-2025, JetBrains s.r.o.
Release history Release notifications | RSS feed


Download files
Download the file for your platform. If you're not sure which to choose, learn more about installing packages.
Source Distributions
Built Distributions
Filter files by name, interpreter, ABI, and platform.
If you're not sure about the file name format, learn more about wheel file names.
Copy a direct link to the current filters
File details
Details for the file lets_plot-4.8.2-cp314-cp314-win_amd64.whl.
File metadata
- Download URL: lets_plot-4.8.2-cp314-cp314-win_amd64.whl
- Upload date:
- Size: 5.9 MB
- Tags: CPython 3.14, Windows x86-64
- Uploaded using Trusted Publishing? No
- Uploaded via: twine/6.2.0 CPython/3.14.2
File hashes
| Algorithm | Hash digest | |
|---|---|---|
| SHA256 |
c02c9247456b4dae73a21be5f6eb98a6d3792b5385971729508030a91d0a6c59
|
|
| MD5 |
2d3bc66c14e1faa26516738832072119
|
|
| BLAKE2b-256 |
cb7b31c745b81885737f6db11ae703cece24bfad1fe9c00d20fb3f2327fd0416
|
File details
Details for the file lets_plot-4.8.2-cp314-cp314-manylinux2014_x86_64.manylinux_2_17_x86_64.whl.
File metadata
- Download URL: lets_plot-4.8.2-cp314-cp314-manylinux2014_x86_64.manylinux_2_17_x86_64.whl
- Upload date:
- Size: 6.8 MB
- Tags: CPython 3.14, manylinux: glibc 2.17+ x86-64
- Uploaded using Trusted Publishing? No
- Uploaded via: twine/6.2.0 CPython/3.14.2
File hashes
| Algorithm | Hash digest | |
|---|---|---|
| SHA256 |
85974b8f7970ad63b21df43f28704bb4625d4fb40ed8941f66407d92bb943941
|
|
| MD5 |
3696f5c8becbceea3ab54cbb442405fa
|
|
| BLAKE2b-256 |
029f9bf2d04b67babf9374b6eff434c5ca37073c22f43198b539d34f09df56a4
|
File details
Details for the file lets_plot-4.8.2-cp314-cp314-manylinux2014_aarch64.manylinux_2_17_aarch64.whl.
File metadata
- Download URL: lets_plot-4.8.2-cp314-cp314-manylinux2014_aarch64.manylinux_2_17_aarch64.whl
- Upload date:
- Size: 6.5 MB
- Tags: CPython 3.14, manylinux: glibc 2.17+ ARM64
- Uploaded using Trusted Publishing? No
- Uploaded via: twine/6.2.0 CPython/3.14.2
File hashes
| Algorithm | Hash digest | |
|---|---|---|
| SHA256 |
aa256e2f8d1849fbd5b7f04dbdf15d5f1238c67c370dd3e223b0df1a797623cb
|
|
| MD5 |
0f63bbb5ff77121cdebac73e9cbe96dd
|
|
| BLAKE2b-256 |
1a111a36ba1babe217bc79471e1d76f4f38cdbea5dfbfac95b36e23c6633c31a
|
File details
Details for the file lets_plot-4.8.2-cp314-cp314-macosx_12_0_arm64.whl.
File metadata
- Download URL: lets_plot-4.8.2-cp314-cp314-macosx_12_0_arm64.whl
- Upload date:
- Size: 5.9 MB
- Tags: CPython 3.14, macOS 12.0+ ARM64
- Uploaded using Trusted Publishing? No
- Uploaded via: twine/6.2.0 CPython/3.14.2
File hashes
| Algorithm | Hash digest | |
|---|---|---|
| SHA256 |
575f8d4309cb9d4816a748e2ab7e1ba2d8b58026efb60773d6bc172d5226fcac
|
|
| MD5 |
2ae5eafc523ea11ad86b8d03ee818ffc
|
|
| BLAKE2b-256 |
54a5d0cf288b382ce563770c7f43f58f820eaa713c9666957b5a9babec7e7fc5
|
File details
Details for the file lets_plot-4.8.2-cp314-cp314-macosx_10_13_x86_64.whl.
File metadata
- Download URL: lets_plot-4.8.2-cp314-cp314-macosx_10_13_x86_64.whl
- Upload date:
- Size: 6.4 MB
- Tags: CPython 3.14, macOS 10.13+ x86-64
- Uploaded using Trusted Publishing? No
- Uploaded via: twine/6.2.0 CPython/3.14.2
File hashes
| Algorithm | Hash digest | |
|---|---|---|
| SHA256 |
1aede126f692e98f8f0a769d9619a431a1ea94bdb0e5decde3a5de41963574f3
|
|
| MD5 |
4a3a47383f0bb4508037f89a97e9286a
|
|
| BLAKE2b-256 |
50905959040e03b36f8f4f01bab0ed2a227ad652ec97a8811329422bbb3ec8b4
|
File details
Details for the file lets_plot-4.8.2-cp313-cp313-win_amd64.whl.
File metadata
- Download URL: lets_plot-4.8.2-cp313-cp313-win_amd64.whl
- Upload date:
- Size: 5.9 MB
- Tags: CPython 3.13, Windows x86-64
- Uploaded using Trusted Publishing? No
- Uploaded via: twine/6.1.0 CPython/3.10.18
File hashes
| Algorithm | Hash digest | |
|---|---|---|
| SHA256 |
5d8fd7ac7987bf687c4ca46f9185b3bb2999ccef39777d58f1d531bd45defa00
|
|
| MD5 |
c73ddaaf5bab7e81f4026500efac1ee3
|
|
| BLAKE2b-256 |
27f2bf2132225d38412ca573e2c628926da764d82879920adcc2e0373397bced
|
File details
Details for the file lets_plot-4.8.2-cp313-cp313-manylinux2014_x86_64.manylinux_2_17_x86_64.whl.
File metadata
- Download URL: lets_plot-4.8.2-cp313-cp313-manylinux2014_x86_64.manylinux_2_17_x86_64.whl
- Upload date:
- Size: 6.8 MB
- Tags: CPython 3.13, manylinux: glibc 2.17+ x86-64
- Uploaded using Trusted Publishing? No
- Uploaded via: twine/6.1.0 CPython/3.10.18
File hashes
| Algorithm | Hash digest | |
|---|---|---|
| SHA256 |
1b871ec8d1aaa56522e7339d2804de582d77d4599a05c526123ecfe8931f6a3a
|
|
| MD5 |
29fad261dbd597f271f7441f7faae6de
|
|
| BLAKE2b-256 |
b8b96ff0979db2ef9323f0c07d6ef1cde559eba918e6132a544b6730648fd28c
|
File details
Details for the file lets_plot-4.8.2-cp313-cp313-manylinux2014_aarch64.manylinux_2_17_aarch64.whl.
File metadata
- Download URL: lets_plot-4.8.2-cp313-cp313-manylinux2014_aarch64.manylinux_2_17_aarch64.whl
- Upload date:
- Size: 6.5 MB
- Tags: CPython 3.13, manylinux: glibc 2.17+ ARM64
- Uploaded using Trusted Publishing? No
- Uploaded via: twine/6.1.0 CPython/3.10.18
File hashes
| Algorithm | Hash digest | |
|---|---|---|
| SHA256 |
fcb77bb46f481e3adddf66193e9cfe8a18357aee9783317df5d1e42559addf5c
|
|
| MD5 |
866563ae28c9ecd9e735825ee6866992
|
|
| BLAKE2b-256 |
f64ee24ec33743db5d31db538a081a540019ce84edbdc68ad6dc26fba466bc2d
|
File details
Details for the file lets_plot-4.8.2-cp313-cp313-macosx_12_0_arm64.whl.
File metadata
- Download URL: lets_plot-4.8.2-cp313-cp313-macosx_12_0_arm64.whl
- Upload date:
- Size: 5.9 MB
- Tags: CPython 3.13, macOS 12.0+ ARM64
- Uploaded using Trusted Publishing? No
- Uploaded via: twine/6.1.0 CPython/3.10.18
File hashes
| Algorithm | Hash digest | |
|---|---|---|
| SHA256 |
8afbcc5ffdf231a0911f6758fb99137a336b60114226b3c11edb24a329e877f7
|
|
| MD5 |
3fd28f94f66734bc96f1b7c56a051c56
|
|
| BLAKE2b-256 |
8d095ae1512ab9f810a806d546a3627b9c484b8af1f87b236d5fe17bbd96f251
|
File details
Details for the file lets_plot-4.8.2-cp313-cp313-macosx_10_15_x86_64.whl.
File metadata
- Download URL: lets_plot-4.8.2-cp313-cp313-macosx_10_15_x86_64.whl
- Upload date:
- Size: 6.3 MB
- Tags: CPython 3.13, macOS 10.15+ x86-64
- Uploaded using Trusted Publishing? No
- Uploaded via: twine/6.1.0 CPython/3.10.18
File hashes
| Algorithm | Hash digest | |
|---|---|---|
| SHA256 |
6dce73ae1dec70eacb2b9f83c2c085d7c89424fc3039291a5e7cced0972904c6
|
|
| MD5 |
e9fd3adb5919022c312ed506e6ca8d9b
|
|
| BLAKE2b-256 |
78c029b864090b5a04396f5b22e3918d293500b0732f5c6a9f56f8d9d4261712
|
File details
Details for the file lets_plot-4.8.2-cp312-cp312-win_amd64.whl.
File metadata
- Download URL: lets_plot-4.8.2-cp312-cp312-win_amd64.whl
- Upload date:
- Size: 5.9 MB
- Tags: CPython 3.12, Windows x86-64
- Uploaded using Trusted Publishing? No
- Uploaded via: twine/6.1.0 CPython/3.10.18
File hashes
| Algorithm | Hash digest | |
|---|---|---|
| SHA256 |
165c85a2b89aabc7d9b41c05000ea379f607ced35416f5906cde313ed8e05c30
|
|
| MD5 |
ac233ca351a166b3d92fafb171071093
|
|
| BLAKE2b-256 |
cba84919641f4956532e21301c67c40c02ca161fb4afd2e76e725a624af357b3
|
File details
Details for the file lets_plot-4.8.2-cp312-cp312-manylinux2014_x86_64.manylinux_2_17_x86_64.whl.
File metadata
- Download URL: lets_plot-4.8.2-cp312-cp312-manylinux2014_x86_64.manylinux_2_17_x86_64.whl
- Upload date:
- Size: 6.8 MB
- Tags: CPython 3.12, manylinux: glibc 2.17+ x86-64
- Uploaded using Trusted Publishing? No
- Uploaded via: twine/6.1.0 CPython/3.10.18
File hashes
| Algorithm | Hash digest | |
|---|---|---|
| SHA256 |
ef403de7988369cdcd14694f49744c219c7401648d3e40a73df1b4eddb0a489e
|
|
| MD5 |
e9b4f3fa953eeaf213f456ba6782b3d9
|
|
| BLAKE2b-256 |
2aaa60ca56b300f88988388907dc551c033198b75443646c00739eac8fcb3b57
|
File details
Details for the file lets_plot-4.8.2-cp312-cp312-manylinux2014_aarch64.manylinux_2_17_aarch64.whl.
File metadata
- Download URL: lets_plot-4.8.2-cp312-cp312-manylinux2014_aarch64.manylinux_2_17_aarch64.whl
- Upload date:
- Size: 6.5 MB
- Tags: CPython 3.12, manylinux: glibc 2.17+ ARM64
- Uploaded using Trusted Publishing? No
- Uploaded via: twine/6.1.0 CPython/3.10.18
File hashes
| Algorithm | Hash digest | |
|---|---|---|
| SHA256 |
facc70ace490845b95fc946044aff2b2fdad37f2faf8e45654d7b772491dcb74
|
|
| MD5 |
f9b21a3318db52d508d7364fa0e2bd57
|
|
| BLAKE2b-256 |
cff5e8121c13facbe0856e23f05a24b43092d9090db30125a90f9487fb7ba124
|
File details
Details for the file lets_plot-4.8.2-cp312-cp312-macosx_11_0_arm64.whl.
File metadata
- Download URL: lets_plot-4.8.2-cp312-cp312-macosx_11_0_arm64.whl
- Upload date:
- Size: 5.9 MB
- Tags: CPython 3.12, macOS 11.0+ ARM64
- Uploaded using Trusted Publishing? No
- Uploaded via: twine/6.1.0 CPython/3.10.18
File hashes
| Algorithm | Hash digest | |
|---|---|---|
| SHA256 |
dc648228b4ba755a9955360623ccab1461794c8fb926aa93b7b2c96d8773dead
|
|
| MD5 |
2b97b83aa9a36a81659a55106f35326d
|
|
| BLAKE2b-256 |
2345af03b985c2c27d876d59c3a18dc1f432b0c4a3a737dccbe65c2c1d490ada
|
File details
Details for the file lets_plot-4.8.2-cp312-cp312-macosx_10_15_x86_64.whl.
File metadata
- Download URL: lets_plot-4.8.2-cp312-cp312-macosx_10_15_x86_64.whl
- Upload date:
- Size: 6.3 MB
- Tags: CPython 3.12, macOS 10.15+ x86-64
- Uploaded using Trusted Publishing? No
- Uploaded via: twine/6.1.0 CPython/3.10.18
File hashes
| Algorithm | Hash digest | |
|---|---|---|
| SHA256 |
3ec736bf53cd49a70f923c90e577ca7437800f5669d1ea670201fbab35956650
|
|
| MD5 |
3295f70480da74211f274489eab0f064
|
|
| BLAKE2b-256 |
f00f482093d67aba3a1f0d455e11ef69af675e2c9dfb4f7a8a8b6eb0f0e511f2
|
File details
Details for the file lets_plot-4.8.2-cp311-cp311-win_amd64.whl.
File metadata
- Download URL: lets_plot-4.8.2-cp311-cp311-win_amd64.whl
- Upload date:
- Size: 5.9 MB
- Tags: CPython 3.11, Windows x86-64
- Uploaded using Trusted Publishing? No
- Uploaded via: twine/6.1.0 CPython/3.10.18
File hashes
| Algorithm | Hash digest | |
|---|---|---|
| SHA256 |
5b173679a97fc9d694537c12278257310c06bcb1ebd3ca7fcbbd23dea0b8c8e3
|
|
| MD5 |
99148c7c326ebc2cc4ac921a11c212ed
|
|
| BLAKE2b-256 |
005324b1859ff4cb4df08f846054c45daf57a6f7da070935272a427b4f0f4850
|
File details
Details for the file lets_plot-4.8.2-cp311-cp311-manylinux2014_x86_64.manylinux_2_17_x86_64.whl.
File metadata
- Download URL: lets_plot-4.8.2-cp311-cp311-manylinux2014_x86_64.manylinux_2_17_x86_64.whl
- Upload date:
- Size: 6.8 MB
- Tags: CPython 3.11, manylinux: glibc 2.17+ x86-64
- Uploaded using Trusted Publishing? No
- Uploaded via: twine/6.1.0 CPython/3.10.18
File hashes
| Algorithm | Hash digest | |
|---|---|---|
| SHA256 |
31833fe762dc2d31624eb84e88e4db88b93ab467e9797af9db128afebdc275ef
|
|
| MD5 |
1dfbfaf70f56de4f92ece1371a501b2f
|
|
| BLAKE2b-256 |
0ef363f9908f503659ac0879542cf3012a3405f89579aae0cf90a9dc2d64bbca
|
File details
Details for the file lets_plot-4.8.2-cp311-cp311-manylinux2014_aarch64.manylinux_2_17_aarch64.whl.
File metadata
- Download URL: lets_plot-4.8.2-cp311-cp311-manylinux2014_aarch64.manylinux_2_17_aarch64.whl
- Upload date:
- Size: 6.5 MB
- Tags: CPython 3.11, manylinux: glibc 2.17+ ARM64
- Uploaded using Trusted Publishing? No
- Uploaded via: twine/6.1.0 CPython/3.10.18
File hashes
| Algorithm | Hash digest | |
|---|---|---|
| SHA256 |
0612765c4878677fef65a7fc1ba87d07c264389fae6158a93a077a9a50e86269
|
|
| MD5 |
c73f65ac6bd53860e5678a7f370cc7b5
|
|
| BLAKE2b-256 |
dd527189ec79f0043dca4c17a9e62d4191e04a8a9fdb1d02db45d594025303f1
|
File details
Details for the file lets_plot-4.8.2-cp311-cp311-macosx_11_0_arm64.whl.
File metadata
- Download URL: lets_plot-4.8.2-cp311-cp311-macosx_11_0_arm64.whl
- Upload date:
- Size: 5.9 MB
- Tags: CPython 3.11, macOS 11.0+ ARM64
- Uploaded using Trusted Publishing? No
- Uploaded via: twine/6.1.0 CPython/3.10.18
File hashes
| Algorithm | Hash digest | |
|---|---|---|
| SHA256 |
67c861af6e9f9ea5b29a8b32a5123c2a21a6ad31232ff77f2cff56286385c393
|
|
| MD5 |
9ad46f38ebf5a35b6fd7c9e7d6afc4a3
|
|
| BLAKE2b-256 |
a9962f381afb2cfc488a736646254ae4211700a1dce7f043ec98f473999c44ae
|
File details
Details for the file lets_plot-4.8.2-cp311-cp311-macosx_10_15_x86_64.whl.
File metadata
- Download URL: lets_plot-4.8.2-cp311-cp311-macosx_10_15_x86_64.whl
- Upload date:
- Size: 6.3 MB
- Tags: CPython 3.11, macOS 10.15+ x86-64
- Uploaded using Trusted Publishing? No
- Uploaded via: twine/6.1.0 CPython/3.10.18
File hashes
| Algorithm | Hash digest | |
|---|---|---|
| SHA256 |
b16c4fca1487a7f88e737fdfca6d35f5f364f40ae04fd9d8f35c513684c3754f
|
|
| MD5 |
26d9baf3b4a2f1e1cd9c0f95c8856a32
|
|
| BLAKE2b-256 |
9bf2687c26783a27cdf29fa74c4bd82dfb59b366520020168db8dedafc1c15b8
|
File details
Details for the file lets_plot-4.8.2-cp310-cp310-win_amd64.whl.
File metadata
- Download URL: lets_plot-4.8.2-cp310-cp310-win_amd64.whl
- Upload date:
- Size: 5.9 MB
- Tags: CPython 3.10, Windows x86-64
- Uploaded using Trusted Publishing? No
- Uploaded via: twine/6.1.0 CPython/3.10.18
File hashes
| Algorithm | Hash digest | |
|---|---|---|
| SHA256 |
b47b4131e6122f650a155feb1c2040977bd60694759d09e3eaa5a4df8b48087b
|
|
| MD5 |
e073919210a177a785e8bd06af0a5a44
|
|
| BLAKE2b-256 |
08d8c0c53feef804972b6e2383f1430814936a20200505e70332c8527155baf9
|
File details
Details for the file lets_plot-4.8.2-cp310-cp310-manylinux2014_x86_64.manylinux_2_17_x86_64.whl.
File metadata
- Download URL: lets_plot-4.8.2-cp310-cp310-manylinux2014_x86_64.manylinux_2_17_x86_64.whl
- Upload date:
- Size: 6.8 MB
- Tags: CPython 3.10, manylinux: glibc 2.17+ x86-64
- Uploaded using Trusted Publishing? No
- Uploaded via: twine/6.1.0 CPython/3.10.18
File hashes
| Algorithm | Hash digest | |
|---|---|---|
| SHA256 |
f53ae86508de13e4f164718d34f39e5e7a57bb2727e3346c79532aa58a215ab6
|
|
| MD5 |
ab815151bbf6f46dcaeaa1fd28b09cfd
|
|
| BLAKE2b-256 |
6a16cf29034346622cd6502427965d63f7a5feb03e91810a01214a9d3701dcf4
|
File details
Details for the file lets_plot-4.8.2-cp310-cp310-manylinux2014_aarch64.manylinux_2_17_aarch64.whl.
File metadata
- Download URL: lets_plot-4.8.2-cp310-cp310-manylinux2014_aarch64.manylinux_2_17_aarch64.whl
- Upload date:
- Size: 6.5 MB
- Tags: CPython 3.10, manylinux: glibc 2.17+ ARM64
- Uploaded using Trusted Publishing? No
- Uploaded via: twine/6.1.0 CPython/3.10.18
File hashes
| Algorithm | Hash digest | |
|---|---|---|
| SHA256 |
ef88be5eee0ac63ac01c3d064bf786df5549b59d2e38c8dfff69008e13e12e55
|
|
| MD5 |
1d04639cf5c02023d66ac45038cfeca5
|
|
| BLAKE2b-256 |
83b4bd0ec1a13614a2247df47fa614736052340ef92aa5ce2cbb04faa05a2623
|
File details
Details for the file lets_plot-4.8.2-cp310-cp310-macosx_11_0_arm64.whl.
File metadata
- Download URL: lets_plot-4.8.2-cp310-cp310-macosx_11_0_arm64.whl
- Upload date:
- Size: 5.9 MB
- Tags: CPython 3.10, macOS 11.0+ ARM64
- Uploaded using Trusted Publishing? No
- Uploaded via: twine/6.1.0 CPython/3.10.18
File hashes
| Algorithm | Hash digest | |
|---|---|---|
| SHA256 |
d5f3c86fa9b8d7e2f0de6df271bb4f48e6833efe0dd78eb48a2cf820dac67bb2
|
|
| MD5 |
2f41f7745cd454a446eb903f483f07da
|
|
| BLAKE2b-256 |
31fd74ee7585b5595671b2292982d65645dd1849a06f83daf399251a6ec338b5
|
File details
Details for the file lets_plot-4.8.2-cp310-cp310-macosx_10_15_x86_64.whl.
File metadata
- Download URL: lets_plot-4.8.2-cp310-cp310-macosx_10_15_x86_64.whl
- Upload date:
- Size: 6.3 MB
- Tags: CPython 3.10, macOS 10.15+ x86-64
- Uploaded using Trusted Publishing? No
- Uploaded via: twine/6.1.0 CPython/3.10.18
File hashes
| Algorithm | Hash digest | |
|---|---|---|
| SHA256 |
22b278dfa23d7c1b044398550a644536cf774fa562630c7572fc8e648d2724e1
|
|
| MD5 |
314c5767ebfc399fd88d46d9c532fcff
|
|
| BLAKE2b-256 |
5380d52c9ca798c6d9493b0384690f626f1e846b7628563c4abd382440c2712a
|
File details
Details for the file lets_plot-4.8.2-cp39-cp39-win_amd64.whl.
File metadata
- Download URL: lets_plot-4.8.2-cp39-cp39-win_amd64.whl
- Upload date:
- Size: 5.9 MB
- Tags: CPython 3.9, Windows x86-64
- Uploaded using Trusted Publishing? No
- Uploaded via: twine/6.1.0 CPython/3.10.18
File hashes
| Algorithm | Hash digest | |
|---|---|---|
| SHA256 |
8b719f38cfa7f6139888f9c4d3d7c296635475fc4829c724a5827d118bae1986
|
|
| MD5 |
42ab7780617a756926db619e31589a38
|
|
| BLAKE2b-256 |
cda1d17b3c87424cb93eb00ae95099d973c93cb52c5b96cf47372eda27ff68a1
|
File details
Details for the file lets_plot-4.8.2-cp39-cp39-manylinux2014_x86_64.manylinux_2_17_x86_64.whl.
File metadata
- Download URL: lets_plot-4.8.2-cp39-cp39-manylinux2014_x86_64.manylinux_2_17_x86_64.whl
- Upload date:
- Size: 6.8 MB
- Tags: CPython 3.9, manylinux: glibc 2.17+ x86-64
- Uploaded using Trusted Publishing? No
- Uploaded via: twine/6.1.0 CPython/3.10.18
File hashes
| Algorithm | Hash digest | |
|---|---|---|
| SHA256 |
90286a409ddb18ea01acbb4cd8f07edae7e82cf9b6e674100ac5b69bd7a42dc7
|
|
| MD5 |
eefecf862c0a61817ac90f5ea73723ad
|
|
| BLAKE2b-256 |
e6fb4dd0e08d0d1e1db5cec2676b62652b3e002ab528893f0d91042564b668e7
|
File details
Details for the file lets_plot-4.8.2-cp39-cp39-manylinux2014_aarch64.manylinux_2_17_aarch64.whl.
File metadata
- Download URL: lets_plot-4.8.2-cp39-cp39-manylinux2014_aarch64.manylinux_2_17_aarch64.whl
- Upload date:
- Size: 6.5 MB
- Tags: CPython 3.9, manylinux: glibc 2.17+ ARM64
- Uploaded using Trusted Publishing? No
- Uploaded via: twine/6.1.0 CPython/3.10.18
File hashes
| Algorithm | Hash digest | |
|---|---|---|
| SHA256 |
d502297fc76f41395d521582fb6a27f843ccadd0b12388ad1beb16c75103ec9a
|
|
| MD5 |
501eb795c19a0ea4f012c8c4b671f865
|
|
| BLAKE2b-256 |
afc8a39be38bf812ba09c6573dfce8cbef7cc4b7deb34aef4b90d75bb7e2fcac
|
File details
Details for the file lets_plot-4.8.2-cp39-cp39-macosx_11_0_arm64.whl.
File metadata
- Download URL: lets_plot-4.8.2-cp39-cp39-macosx_11_0_arm64.whl
- Upload date:
- Size: 5.9 MB
- Tags: CPython 3.9, macOS 11.0+ ARM64
- Uploaded using Trusted Publishing? No
- Uploaded via: twine/6.1.0 CPython/3.10.18
File hashes
| Algorithm | Hash digest | |
|---|---|---|
| SHA256 |
bd0d5ccb332503a9ebd540221bf0df763d97088645996f63b3a2129043c7ebdf
|
|
| MD5 |
04f92baee5e2e275c645db6c1963db48
|
|
| BLAKE2b-256 |
f3fd67bb042182ad4b9865634eb65e935e8e6c25d791dc2dd4307e9199f91560
|
File details
Details for the file lets_plot-4.8.2-cp39-cp39-macosx_10_15_x86_64.whl.
File metadata
- Download URL: lets_plot-4.8.2-cp39-cp39-macosx_10_15_x86_64.whl
- Upload date:
- Size: 6.3 MB
- Tags: CPython 3.9, macOS 10.15+ x86-64
- Uploaded using Trusted Publishing? No
- Uploaded via: twine/6.1.0 CPython/3.10.18
File hashes
| Algorithm | Hash digest | |
|---|---|---|
| SHA256 |
68b5a5de2a9a9258260f5a927173d02132ea8288ec3953880cb6fa1b18f797d5
|
|
| MD5 |
eb5763b41d3dd60642f65c2bdc3c8502
|
|
| BLAKE2b-256 |
7c1382618ed91c1eb76d83421dddf63ce0b570ed56f3ca0dacb1a37b2eca5296
|


